The following is a guest post by Tom Liu, a health care researcher in Washington, D.C. with a B.A. in Biology and Public Policy from Swarthmore College. Find him on Twitter at @tliu14 or at his personal blog, In Sight.
Galen Benshoof wrote an excellent post last month about how people erroneously blame the ACA for the spread of high-deductible health plans. When I read it, I was immediately reminded of another trend that people tend to ascribe to the ACA. From The White House Blog:
For years, health care costs in America skyrocketed, with brutal consequences for our country. […] The Affordable Care Act, for the first time in decades, has helped to stop that trend.
The White House isn’t alone in crediting the ACA for some role in the slowdown in growth in health care spending. Robert York and colleagues have been arguing since last year (an argument they reiterated this year) that an observed decline in inpatient utilization is primarily due to the shift toward value-based care. They use the Chicago market as an exemplar:
Advocate’s success in reworking the system to align incentives for value-based care under a population health management contract with BCBSIL [Blue Cross Blue Shield of Illinois] appears to be helping to push the entire Chicago metro market toward lower utilization. Inpatient use rates per 1,000 in Chicago, Cook County, and Illinois have decreased by 6 percent to 7 percent between 2007 and 2011.
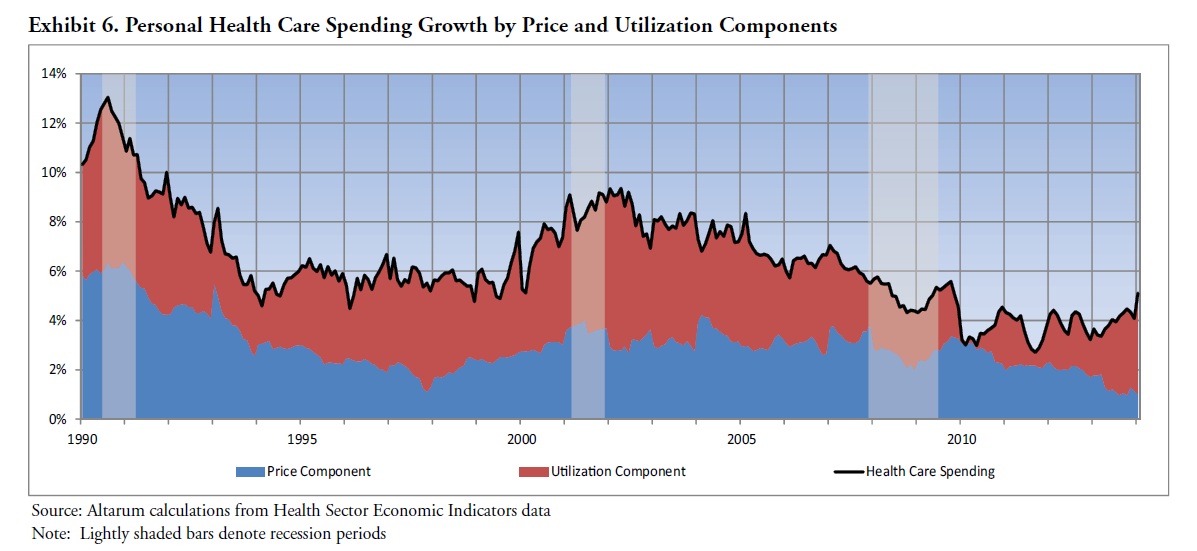
There’s just one problem: Advocate’s “population health management contract with BCBSIL” is an accountable care organization (ACO) arrangement that wasn’t established until late 2010. And as you can clearly see from their graph, the slowdown in inpatient utilization in Chicago began as early as 2005. In fact, the Chicago situation echoes a national trend, casting doubt on the hypothesis that ACA delivery system reforms are the primary cause of reduced health care spending.
As you can see from this graph from the Altarum Institute below, the slowdown in health spending growth began as early as 2003. And nearly all of that slowdown came from slowing growth in utilization:
While reducing unnecessary utilization is one goal of ACA delivery system reforms, those reforms didn’t predate the signing of the law. For example, the Medicare Shared Savings Program and Pioneer ACO programs weren’t launched until 2012. And they are still finding their footing—of the 32 Pioneer ACOs (arguably best poised to achieve utilization reduction), only eight of them significantly slowed cost growth relative to their local markets in their first year. More dramatic value-based models such as Iora Health or Qliance, which can claim inpatient reductions of up to 41%, are only just beginning to achieve scale.
Something else must be causing the slowdown in utilization growth over the last decade.
Amitabh Chandra and colleagues came to this same conclusion In a September 2013 Brookings paper, which Adrianna and Austin covered on TIE. Specifically, Dr. Chandra and colleagues attribute the major drivers of slower growth rates in spending since 2005 to “changes in relative prices to consumers and providers, and technological growth—each of which will affect private, Medicare, and Medicaid patients differently.”
Combining their projections in growth rates for prices, utilization, and the effect of aging, they project a long-term growth rate of GDP plus 1.2% for health care spending, substantially lower than the historical growth rate of GDP plus 2.4%.
However, just when people became optimistically hopeful that it really is different this time, the Altarum Institute released updated data showing that year-over-year growth in overall NHE reached 6.7% in February, its highest level since March 2007.
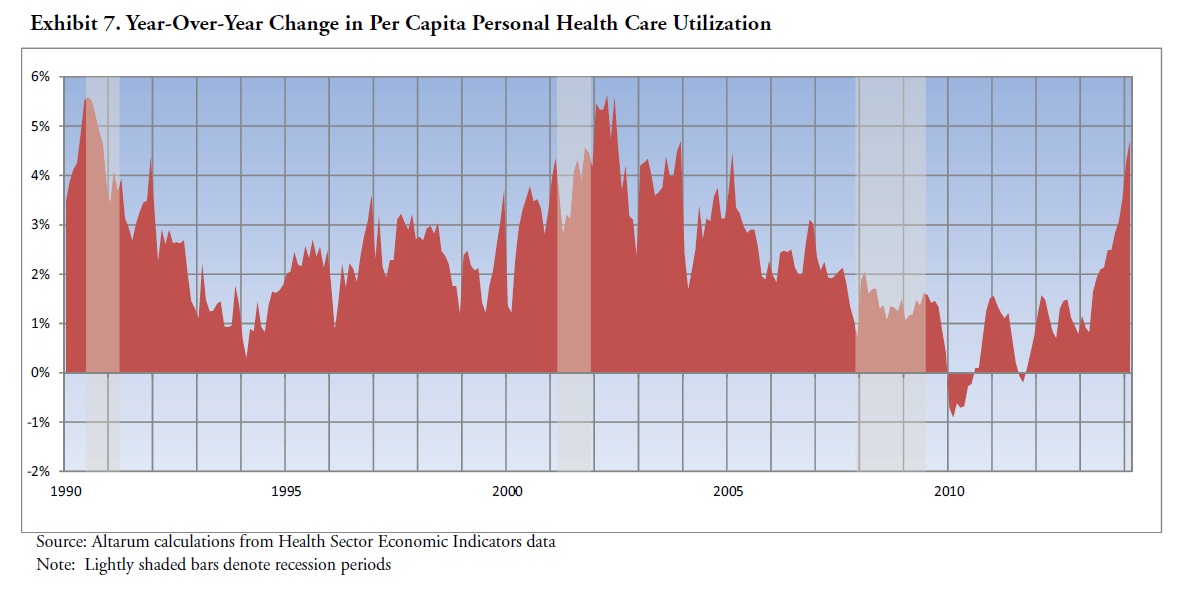
More importantly, most of that uptick is driven by an acceleration in utilization. This is concerning because Chandra et al.’s projections assume 2008-2012 utilization growth rates. As is apparent from the graph below, per capita utilization growth during that period was among its lowest of the last decade.
Understanding what’s driving this recent uptick in utilization is key to answering whether we can expect health care spending growth to moderate in the long term. Ironically, the ACA may be causing some of this recent surge in spending—but not in the way most people might think.
As the Altarum Institute report points out, growth in NHE has been accelerating since the fourth quarter of 2013, months before the insurance coverage through the ACA’s exchanges went into effect. However, this uptick may still have been driven by the newly insured—but not through the exchanges. According to the recent RAND report, a net of 9.3 million people gained insurance during this same time period—primarily driven by an increase of 8.2 million people gaining employer-sponsored coverage.
As Amitabh Chandra and Peter Orzag discussed via Twitter, expanded insurance coverage overall could have driven some of the surge in spending. And as Adrianna noted, the ACA’s individual mandate could have nudged employees to take coverage they had previously turned down.
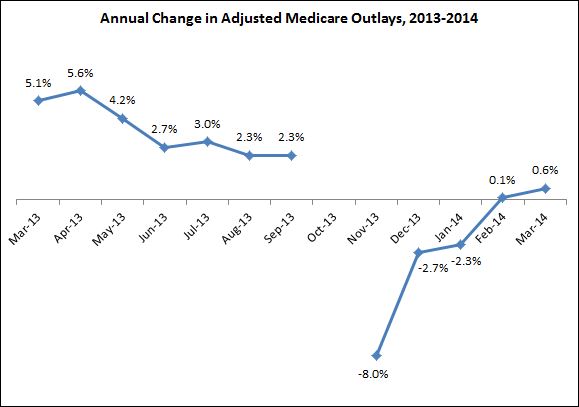
One final note: As Dr. Orzag suggested, if insurance expansion does indeed explain most of the recent uptick in spending, we might expect that Medicare expenditures would see no concurrent acceleration. I looked up the CBO monthly budget reviews and plotted the year-over-year adjusted growth in Medicare outlays for the last year:

As you can see, the data are mixed. On the one hand, Medicare spending growth does indeed remain below the levels we saw earlier in 2013. On the other hand, growth has technically been accelerating since November 2013, suggesting the uptick in spending may not be completely confined to private insurance.
In sum, although the case that the ACA had a significant impact on the recent downturn in health care spending growth is relatively weak, the case that it is contributing to renewed growth could have some legs. It’s also what we should expect if coverage expansion occurs.


