
If RAND’s latest report is accurate, the uninsured rate among 18-64 year old adults in the United States fell by 23 percent—from 20.5 percent to 15.8 percent—between September 2013 and March 2014. And if RAND is right, that’s big news—but it’s probably not the news we were expecting.
First, a brief background on the methodology: RAND conducts their survey on a nationally representative sample of about 2,500, with results weighted against the Census. The same individuals are surveyed month to month, which allows the investigators to estimate both net changes in coverage and transitions between insurance types. I recommend reading the whole report (it’s not onerously long).
There are the two key tables, and I’ve highlighted numbers that I think are worth attention. This table shows net changes in insurance by coverage type between September and March:
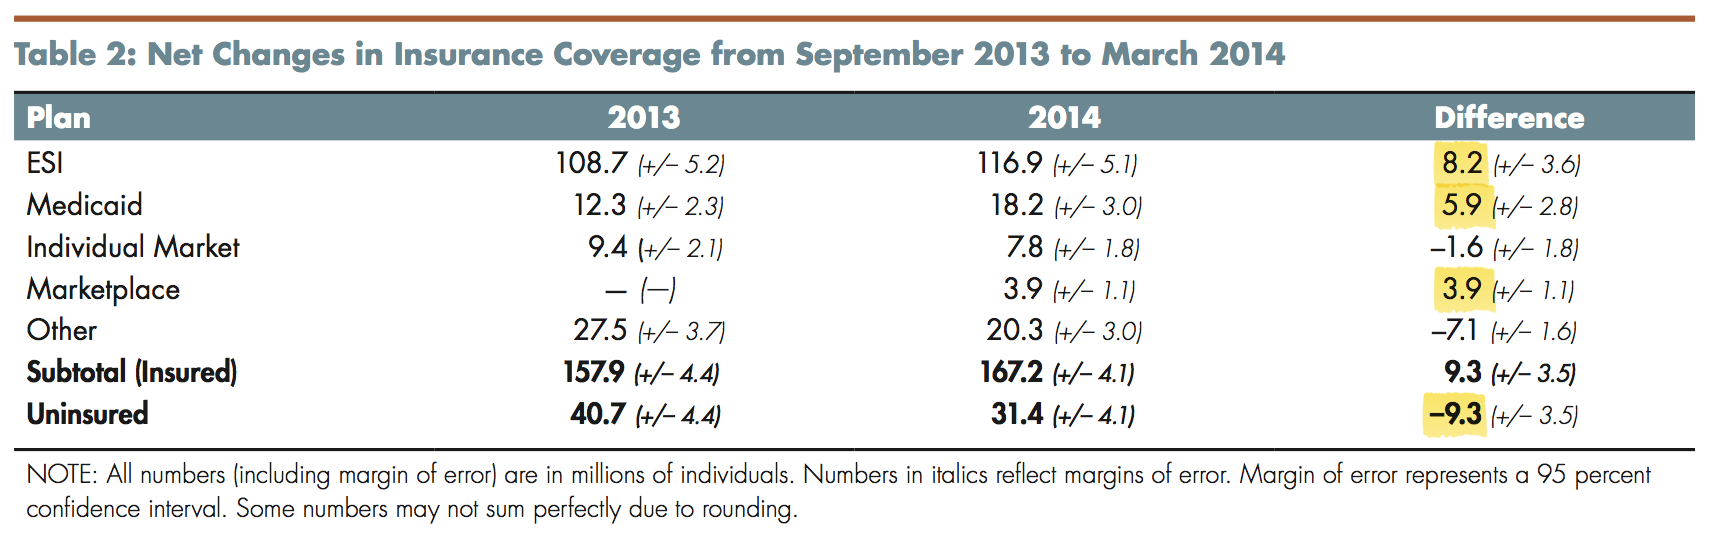
On net, RAND estimates that 9.3 million people gained coverage; that reflects 14.5 million obtaining insurance and 5.2 million cycling out of coverage. The latter detail isn’t explicit in the table above because of churn between coverage types. It’s worth noting that the confidence intervals are pretty wide here, given the limited sample size. The net gain in coverage, for example, has a margin of error of +/- 3.5 million. RAND reports all margins of error in parentheses under each estimate.
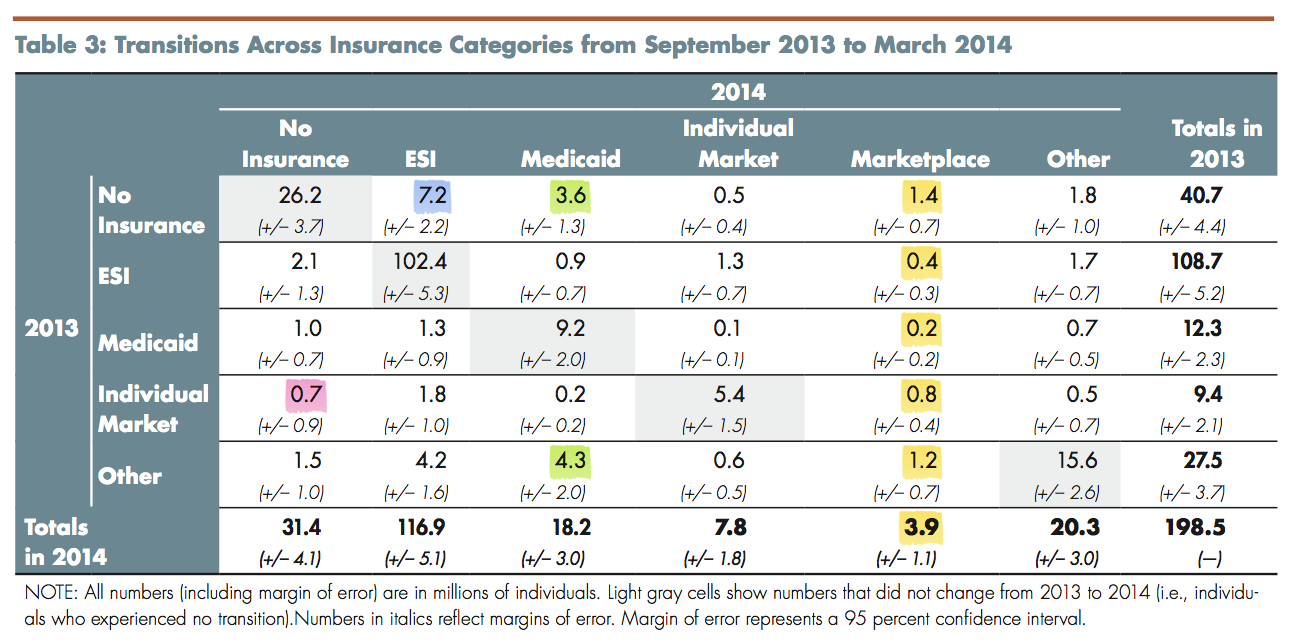
Below is the money shot: a comprehensive look at transitions between different kinds of coverage. Notably, among those who cycled out of coverage—that 5.2 million I mentioned—the vast majority did not fall out of the individual insurance market because their plans were canceled. According to the first column, about 700,000 people went from the individual market to being uninsured; that’s a sobering number in real terms, of course, but it comprises less than 15% of all people who lost coverage over the timeframe.
Here’s what’s startling: employer-sponsored insurance—not Medicaid or the exchanges—drove the net reduction in uninsured. An estimated 8.2 million took up employer-sponsored plans, and most of them were previously uninsured. I can’t overstate how stunning this finding is if it’s true; CBO expected that ESI gains and losses would pretty much break even in 2014 and that employer coverage would decline modestly in future years (p. 108).
If it’s correct, it was probably motivated multiple factors—I hate the word “synergy” on principle, but it comes to mind. The economy has been improving, so some of the previously unemployed have secured jobs with benefits. But CBO built in expectations about economic recovery, so I don’t think it’s quite right to try pinning all (or even most?) of the 8.2 million on that. The individual mandate, while weak in its first year, might be a stronger stick than we expected, nudging people to take their health benefits where they’d previously been opting out. Employers could be helping this move this trend along; the University of Michigan, for example, eliminated “opt out dollars” in 2014 (cash compensation for employees who declined coverage).
It’s possible that the ESI spike is statistical noise—that RAND’s sample is meaningfully different from the national population in some way. But it would have to be quite the aberration; the lowest bound of the 95% confidence interval still puts 5 million previously uninsured people moving into employer-sponsored coverage. If RAND is on target, it suggests that ESI eclipsed the exchanges in reducing the number of uninsured. (This provokes an interesting policy question about how deeply the ACA is entrenching our employer-based model of health insurance and whether that’s good or bad, but I’ll leave that for another post.)
Another detail worth noting about the report: it probably doesn’t capture much of the late-March surge in the exchanges (reflected in their low enrollment estimate). The survey was conducted through March 28th, meaning many would have responded early in the month and the last three days weren’t captured at all. Right now, the survey suggests that 36% (1.4 million) of marketplace enrollees were previously uninsured, but that could be revised when RAND follows up with new findings in April.
This isn’t the only study trying to get a handle on enrollment and coverage; the Urban Institute published findings last week that suggested a much more modest reduction in the uninsured (5.4 million to RAND’s 9.3 million). Going forward, it’s our job as intelligent human beings to weigh the different evidence that becomes available and try to draw nuanced inferences.
Here’s what you can’t do with the RAND survey: you cannot claim it’s flawed because you think the hike in employer coverage is “implausibly high” while also crowing that it shows “only” 1.4 million in the exchanges had been uninsured. The empirical uncertainty here permeates all findings—not just the ones you don’t like. That’s how this works.
Adrianna (@onceuponA)
