
These are early days, but so far the Affordable Care Act is working. Rates of uninsured persons are down. Millions of people are enrolling. The Congressional Budget Office thinks that it will cost less than they originally projected. The Massachusetts Mortality Study showed that RomneyCare, the ACA’s model, is improving health outcomes (see discussion by Austin here, here, and here; Adrianna here; and me here, here, and here.)). And even Healthcare.gov seems to be working.
Nevertheless, the ACA’s successes haven’t improved the public’s view of the ACA. The bill was always controversial and just barely passed Congress. However, proponents expected that as the bill was implemented and began to work, it would gain popularity. But instead it’s losing ground.
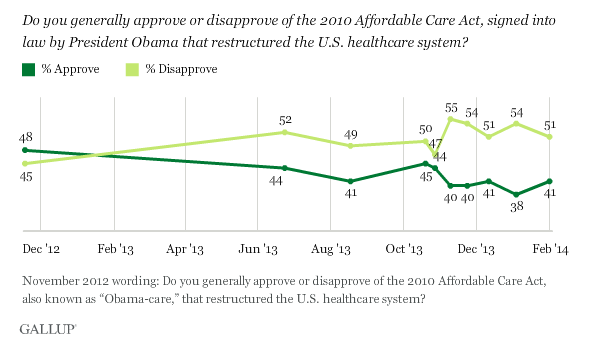
Similarly, Gallup finds that more Americans think that they and their families will be harmed by the ACA than those who think they will benefit.
So why is the law doing better and yet, to most people, looking worse? Here are two explanations.
The first explanation is that a lot of Americans are misinformed about the ACA. They say they like what’s in the bill, but they don’t like the bill itself. To be clear: plenty of people know what’s in the law and oppose it for just that reason. But most of us don’t have a detailed knowledge of the ACA. And it seems that the less you know, the less you like it.
Jon Krosnick, Wendy Gross, and colleagues at Stanford and Kaiser ran large surveys to measure public understanding of the ACA and how it was associated with approval of the law. They found that accurate knowledge about what’s in the bill varied with party identification: Democrats understood the most and liked the law the most, independents less, and Republicans understood still less and liked the law the least. However, attitudes were not just tribal. Within each party, the more accurate your knowledge of the law, the more you liked it.

Krosnick and colleagues found that most people favor most of the elements of the ACA, but not everyone recognized that these elements were all in the plan. Many people also have false beliefs about the plan. For example, only 42% of Americans correctly understood that the law does not provide free treatment for illegal aliens. Only 21% of Americans approve of this imaginary feature of the plan.
This suggests that if the public understood the ACA perfectly, support for the law would be higher. Based on their model for how knowledge about the ACA is associated with approval for the law, Krosnick and colleagues project that in the unlikely case in which the public had perfect understanding of the law,
the proportion of Americans who favor the bill might increase from the current level of 32% to 70%.
Keep in mind, however, that Krosnick’s survey can’t show us that change in knowledge would cause change in approval. Perhaps causality runs the other way and it is approval of the law that drives people to seek information about what is in it.
Krosnick’s work leaves another important question open. There’s no obvious reason why ignorance of what’s in the law should be associated with disapproving of it. Why wouldn’t you expect that not knowing the content of the law would lead you to favor it? People seem to be motivated to disapprove of the law in the absence of having information about it. Why are they motivated in that way?
So here’s the second explanation why people don’t like the ACA. Let’s ask who wins and who loses on a cash basis as a result of the bill.
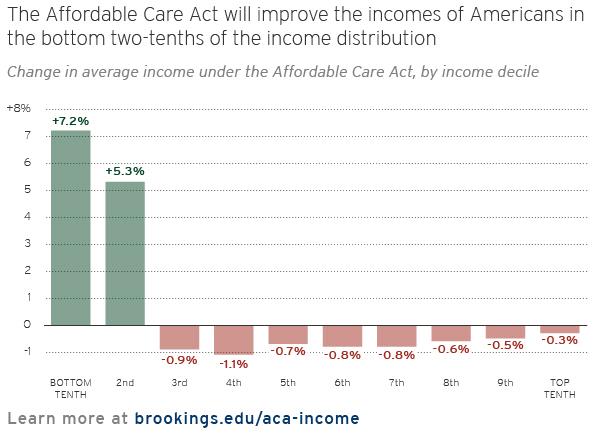
The ACA does lots of things and one of them is to shift money around so that some people who were previously unable to afford health insurance can now pay for it. Henry Aaron and Gary Burtless estimated the net percentage income gains and losses for Americans as a result of the ACA for each decile of the income distribution. As you see, the ACA reduces the incomes of the top 80% and increases those in the bottom 20%.
The ACA has many other effects on people’s economic prospects. For example, the ACA makes it possible to get insured despite having a pre-existing condition. You can also get insurance even if you lose a job in which you previously had employer-supplied insurance.
People don’t make judgments about policy based just on how it affects their pocketbooks. But to the extent that income effects do matter, Aaron’s chart makes it is easy to see why the ACA is unpopular. Looking only at the income transfers, there are many more losers than winners. And Kaiser’s polling shows that the proportion of people who disfavor the ACA is higher in the higher income quintiles.
This effect is amplified when people go to the polls. The graph below (from Jan Leighley and Jonathan Nagler) shows US voter turnout over many elections as a function of income quintile (q1, the bottom line, is the poorest quintile, q5 at the top is the richest. These are survey data, so they overreport actual turnout).
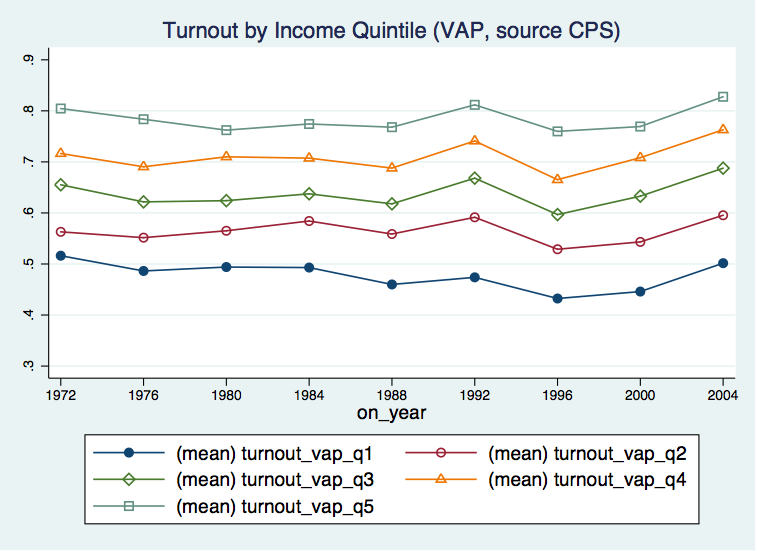
The top line shows that 80% of voters turnout in the highest quintile but only 50% do in the lowest quintile. So the electorate over represents those who pay for ACA subsidies and under represents those who receive them (see also Matt Bruenig here).
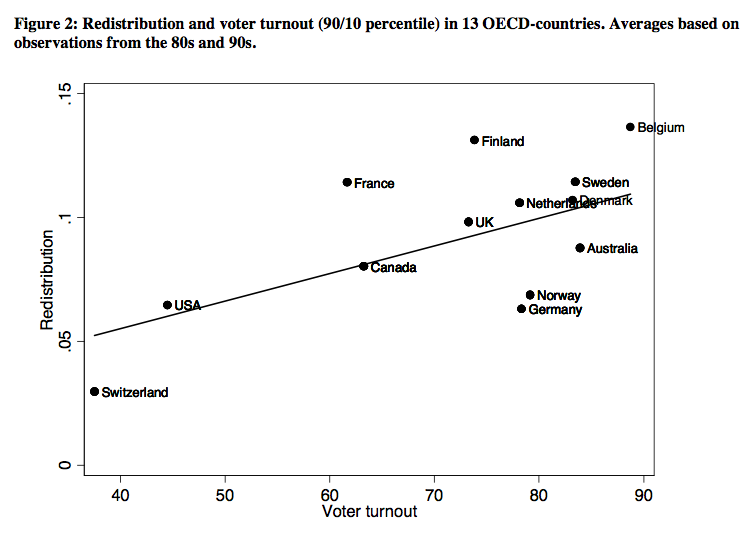
The electorate, therefore, has a greater interest in opposing the ACA than does the nation as a whole. However you want to explain the poor turnout of poor people in the US, their low turnout loads the dice against egalitarian social policy. This is consistent with Henning Finseraas’s finding that democracies with higher voter turnout do more social redistribution.
If these explanations are right, then support for the ACA might be higher if the law were simpler and people had more accurate knowledge of it. It would also be higher if the distribution of winners and losers mattered less, that is, if Americans valued equitable access to health care more and were less concerned about the imposition of additional taxes.
The problems I’ve discussed pose serious challenges for health care progressives. These tasks aren’t hopeless: we have Medicare, Medicaid, Food Stamps, and Social Security. But it is important to understand why the ACA has been a harder lift.
Thanks to @Matt_Bruenig for tweeting the Aaron and Burtless chart. Thanks to Austin for penetrating questions about an earlier draft of this post.
