A few commenters have questioned my power calculation on the Oregon Medicaid study, claiming different results. Though I can’t be sure what they are doing wrong (if anything), I did take the time to do several more checks of my calculation. These are in the technical footnote to this post.* Even though it’s weedy, if you’ve followed this story this far, you might want to look. It shows how you can do power calculations at home, with no money down! Meanwhile, the offer stands: if you find an error in my work, please let me know, but read the footnote first.
The question has been raised about how the study’s blood pressure findings compare to that of the RAND Health Insurance Experiment. (Harold also discussed this.) First, let’s deal with power. The baseline rate of elevated blood pressure in the Oregon study was 16.3% and the point estimate of the effect of Medicaid was a reduction of 1.33 percentage points. These are both bigger than the blood sugar (glycated hemoglobin, GH, A1C) results, which was the focus of my power calculation. So, maybe the blood pressure analysis was sufficiently powered. We have a calculator. Let’s find out!* (Of course, the 95% confidence intervals give us an answer, but how underpowered is it?)
No, the blood pressure analysis was no more adequately powered than the blood sugar one. Even though the baseline rate is a lot higher, the hypothesized effect size isn’t. However, the study was powered at the 0.85% level to find a reduction in proportion of the population with high blood pressure of 3 percentage points (more than twice the point estimate effect size). See, power depends on what question you’re asking.
I’m told, but have not independently verified, that the RAND HIE did find statistically significant results on blood pressure. That study had a sample size of 7,700 across four levels of cost sharing and followed participants for 3-5 years. The design and analytic approach were different than the Oregon Medicaid study, which could explain a difference in statistical significance. Also, RAND’s effect size was larger.
About this, Kate Baicker, the lead author of the Oregon Medicaid paper, wrote me,
The confidence intervals of our estimates of the impact of Medicaid tell us what effect sizes we have the power to reject. This can be read off of our reported confidence intervals. Consider, for example, the case of blood pressure. Table 2 indicates that over 16 percent of our control group has elevated blood pressure. For diastolic blood pressure, we see in Table 2 that the lower end of our 95 percent confidence interval is -2.65 mm Hg. This means that we can reject a decline in diastolic blood pressure of more than 2.65 with 95 percent confidence.
For context, it is instructive to compare what we can reject to prior estimates of the impact of health insurance on blood pressure. In particular, the RAND Health Insurance Experiment – which varied only the generosity of insurance coverage among the insured and not whether enrollees had insurance at all, as in the Oregon Health Insurance Experiment – found a reduction of 3 mm Hg in diastolic blood pressure among low-income enrollees. Quasi-experimental studies (previously published in NEJM) of the one-year impact of the loss of Medicaid (Medi-Cal) coverage among low-income adults found changes in diastolic blood pressure of 6 – 9 mm Hg (Lurie et al. 1984, 1986). The estimates in Table 2 allow us to reject that Medicaid causes a decline in diastolic blood pressure of the magnitude of the effects found in these prior studies. (These RAND and Medi-Cal estimates are based on a sub-population in disproportionately poor health, so one might instead compare their estimates to our estimates in our Appendix Table S14c showing the impact of Medicaid on diastolic blood pressure among those diagnosed with hypertension prior to the lottery. For this group we can reject a decline in diastolic blood pressure of more than 3.2 mm Hg with 95% confidence).
I don’t know what else I can say about all this. If you want to know if the study could reject the possibility that Medicaid had no effect on the physical health measures examined at 2-years of follow-up with 95% confidence, the answer is “no.” At the same time, the sample size was too low to be able to do that for all but very large effects. That’s just a mathematical fact. For effect sizes one might reasonably consider appropriate (and that are certainly clinically meaningful), the study would have had to have been several multiples larger (a factor of five is what I get). Again, that’s just math.
Please stay for the technical footnote:
* TECHNICAL FOOTNOTE: In contrast to what most people may think, I largely post on TIE to further my own knowledge and understanding, not to convince anyone of anything. So, if anyone finds errors in what I’ve written, I’m happy for the correction. But, I also recognize that I’m posting for a wide audience, and so I worry about the validity of the content of my posts long after they’re public. I continued to worry about my sample size calculation yesterday and this morning.
To increase confidence I had not made a grave error, I did my sample size calculation two additional and independent ways. First, it turns out Stata’s sampsi can be used many ways to do the same thing. Some ways require less input than others, which is safer since it is always possible to misunderstand what the proper form of the input is. Nevertheless, no matter how I used sampsi, I got the same answer, which is comforting.
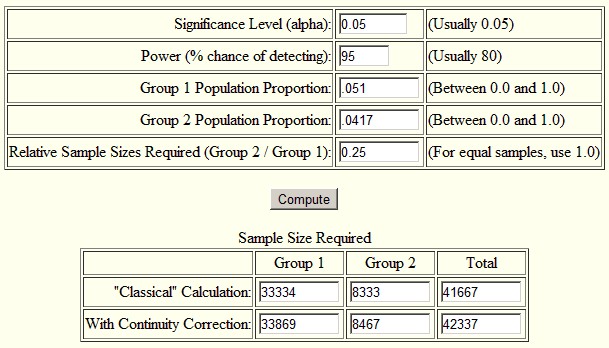
Second, I used an online sample size calculator for the difference in proportions. I used the one here, but if you Google around, you’ll find others. Again, I got the same result as with sampsi. I encourage you to try it yourself. Below is a screenshot of the inputs and outputs for the calculation in my post. The only thing I didn’t mention in my post is what alpha is. It’s the probability of rejecting the null hypothesis (that Medicaid had no effect) under the assumption that it is true, the “p-value” of an estimate. Typically one seeks a value of 0.05 or lower. (Super geeky aside, “power” is not the same thing as “p-value.” The former is the probability of rejecting the null when it is false, the latter of rejecting it when it is true.)