Don’t let anyone assert (without data) that the aging US population is to blame for our high health care costs. Look at Japan. Despite one of the oldest population in the OECD and health expenditures half the US amount, Japan enjoys much longer longevity. Some data from today’s Lancet is in Table 1 at the bottom of this post, but for a more comprehensive approach, see Aaron’s 10-part, must-read cost series using the same OECD dataset. (See also his comparative quality series).
The more interesting part of this article is how Japan achieves these results. First, what they don’t do:
During the past three decades, Japan’s health-care system has effectively managed to contain costs despite many factors that are typically associated with high costs: a private-sector dominated delivery system, payment by fee-for-service, and no gatekeeper function by family doctors.
How does Japan achieve better outcomes with older people at half the cost?
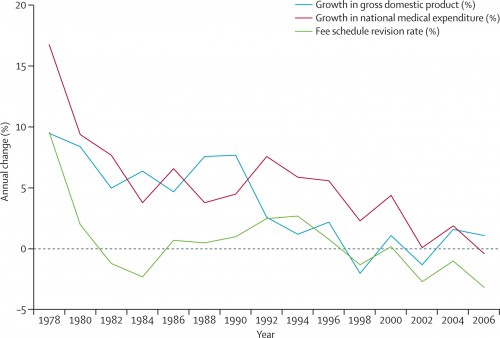
The Japanese health-care system has two contrasting features: tight supply-side control of payment by the fee schedule and a laissez-faire approach to how services are organised and delivered. Costs have been contained by setting of the global revision rate and subsequent item-by-item price revisions of targeted services and drugs.
- Less intensive inpatient care – many fewer surgeries with general anesthesia, reflecting both institutional biases and a cultural preference for less invasive treatments.
- All payer rate setting – a single national fee schedule that 3500 private plans use, which has been effective in reducing overall health expenditures (cf. Maryland; prior TIE all-payer coverage here):

- The authors conclude with a heretical thought for doctors and hospitals — perhaps the medical care system doesn’t have much to do with population health:
One answer might be that the structure and process aspects of quality of care are not that important for outcomes.
I can hear every public health person applauding. Meanwhile, in completely unrelated news, the Obama Administration proposes to cut the Prevention and Public Health Fund by $3.5 billion.
Table 1. Health-care use, expenditure, and resources in Japan compared with selected OECD member countries, 2008*

