Since there is no true apples-to-apples cost control comparison of public programs with private insurance, we have to make do with second- and third-best approaches. (For many of them, see the FAQ entry.) Here’s one that hasn’t yet graced the pages of TIE: the (private plan based) Federal Employees Health Benefits Plan (FEHBP) vs. traditional Medicare (excluding Medicare Advantage and private drug plans).
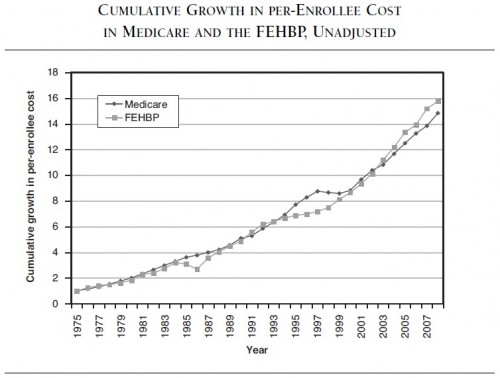
In his book Putting Medicare Consumers in Charge: Lesson from the FEHBP, Walton Francis makes that comparison in two ways. (My review of the book is here.) The first is a straight-up, no adjustment plot of cumulative growth in per person spending by the two programs:
Overall, the two programs have about the same cost growth, with FEHBP outperforming Medicare on cost control in much of the 1990s and Medicare outperforming FEHBP since 2002 or so. All in all, I’d call it nearly a toss up. There’s no clear reason to prefer one program over the other on the basis of the above chart alone.
However, Francis makes the argument that this is not a fair comparison because FEHBP plans are far more generous, on average, than is Medicare. For example, though Medicare had no program-wide prescription drug benefit until 2006, FEHBP plans offered drug coverage over the span of years illustrated. More importantly, since we’re examining growth, not levels, FEHBP plans got more generous over time as Medicare’s benefit stayed fairly constant. For instance, FEHBP plans eliminated hospital day limits and benefit maximums, added catastrophic protection, and reduced deductibles in real terms over the decades.
Francis accounts for the growing generosity of FEHBP plans by including beneficiary cost sharing in the mix. At first this may not make sense to you. But, think about it. If coverage has gotten more generous that means people had to pay less out of pocket for care. Since we’re examining growth, not levels, the (slowing) growth in out of pocket costs is a measure of (increasing) program generosity. As Francis points out, enrollees out of pocket payments “have decreased from about 40 percent of total payments under the average plan (enrollment-weighted) to about 13 percent over the last third of a century.”
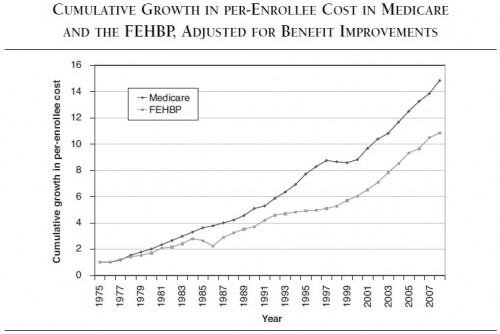
Including out of pocket payments in the calculation of FEHBP cost growth, as a way of controlling for increasing generosity, Francis arrives at the following chart. It compares the same Medicare growth as in the prior chart, above, to FEHBP, which is adjusted for benefit generosity as described.
With FEHBP so adjusted, it appears to outperform Medicare on cost control by a wide margin. I will explain later today why I do not think this is the right (or full) interpretation. First, some things to note:
- Medicare cost growth has not been adjusted for out of pocket costs as has FEHBP. Though it is plausible Medicare’s out of pocket cost growth is lower than FEHBP’s, as Francis suggests, I have not seen the data that proves it. (In a subsequent post, for the purposes of argument only, I accept the notion that Medicare out of pocket cost growth is negligible.) Out of pocket spending by Medicare beneficiaries has grown, though slowly, as a proportion of income.
- Francis explains that FEHBP is the primary payer for federal workers who are also Medicare beneficiaries. This serves to lower Medicare’s costs as the federal work force ages. On the other hand, he adds that Medicare can be the primary insurer for federal retirees (FEHBP being a potential secondary one), which serves to lower the rate of growth in FEHBP costs as the population ages.
- Francis points out that the federal work force has aged, which has increased the programs costs. I do not know if it has aged faster than the (traditional) Medicare population. Controlling for differential changes in age and other demographic factors would be another type of adjustment one would want to make in a more complete analysis.
- Frances suggests that Medicare Advantage (MA) and Medicare prescription drug plans reduce the costs of traditional Medicare. There is work that shows offsets due to drug coverage. There is also work that shows MA may have had cost saving spillovers to traditional Medicare, but these may have been wrung out years ago.
If one wanted to kick up a lot of dust to cast doubt on Francis’s conclusions that FEHBP has controlled costs better than Medicare, these four points are where one might start. However, that is not my aim. My aim is to explain a fuller interpretation of the two charts. I will do that in a subsequent post. Look for it at noon today.


