How good a program is the Medicare Part D drug benefit (implemented in 2006)? Your answer should depend on what you compare it to and what metric you use for comparison. In a recent paper in JAMA, Michael McWilliams, Alan Zaslovsky, and Haiden Huskamp examined cost offsets, i.e. to what extent did Part D affect non-drug Medicare spending?
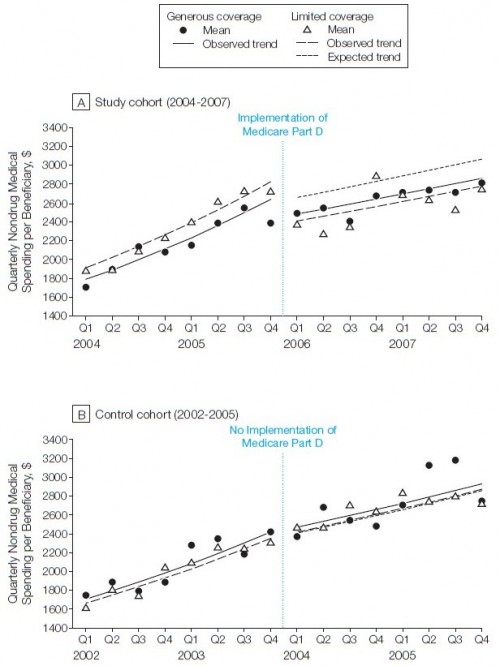
Using Health and Retirement Survey data linked to 2004-2007 Medicare claims, they examined the change in medical spending for a cohort of Medicare beneficiaries who had limited drug coverage before initiation of Part D. They compared this change to a cohort with generous drug benefits. They also compared these analyses with trends over 2002-2005. The findings are summarized in the following chart. There’s a lot in it, so I’ll talk you through it below.
Look at the top panel, labeled “A”, first. The horizontal axis is year and quarter. At the beginning of Q1 of 2006, Part D was implemented, as shown. The vertical axis is mean quarterly non-drug spending, adjusted for baseline sociodemographic and health characteristics. The solid dots and solid line represent the cohort with generous* drug coverage before implementation of Part D. Following the data for that cohort across implementation of Part D, we see that non-drug spending first dropped and then rose at a lower rate compared to prior to Part D.
The same thing happened to a cohort with limited* drug coverage, as represented by open triangles and dashed lines. A third, dotted line is shown after Part D implementation. That’s the level of non-drug spending that would have been expected of the limited drug coverage cohort if they had experienced the same degree of change in non-drug spending as the cohort with generous drug benefits. Because the dashed line is so much lower than the dotted line Part D can be credited with substantially more in non-drug savings for beneficiaries with limited drug coverage than those with generous drug coverage before Part D implementation.
The bottom panel, labeled “B”, merely illustrates that no such difference exists between expected and actual trend for a cohort of beneficiaries with limited drug coverage over an equivalent span of time, but prior to Part D implementation. Translation: no Part D, no savings. It lends supports to the claim that the effect in the top panel is indeed an effect of Part D.
How big are the differences between observed and expected non-drug spending? Overall, $306/quarter, $204/quarter for Part A services and $67/quarter for Part B services. (Parts A and B subtotals don’t sum to the overall total because “they do not include smaller contributions from spending on home health, durable medical equipment, hospice, and outpatient institutional services.”)
One conclusion is that prior to Part D, those with limited drug benefits were substituting with other types of non-drug care to a greater extent than those with generous drug benefits. Thus, when those with limited benefits had Part D coverage, they reduced non-drug spending to a greater extent.
In terms of policy, the authors conclude,
Despite a lack of financial incentives for standalone Part D plans to design coverage and formularies to minimize Medicare Part A and B spending or to share claims data with clinical providers to assist them in monitoring medication adherence, expanded drug coverage for seniors provided by these plans was associated with significant reductions in nondrug spending. Greater coordination of benefits and delivery across Parts A, B, and D might augment this substitution of drug for nondrug services suggested by our findings and improve the overall cost-effectiveness of the traditional Medicare program. In particular, accountable care organizations may perform better against Part A and B spending targets by ensuring that assigned beneficiaries have drug coverage and by working with Part D plans to align drug benefits and data systems with quality improvement and cost-saving efforts.
(Related: Does Medication Adherence Lower Medicare Spending among Beneficiaries with Diabetes, by Bruce Stuart et al. “Higher adherence with RAAS-Is and statins by Medicare beneficiaries with diabetes results in lower cumulative Medicare spending over 3 years. At the margin, Medicare savings exceeded the cost of the drugs.”)
* “Generous” means mostly or completely covered for drugs. “Limited” means partially or not at all covered for drugs.


