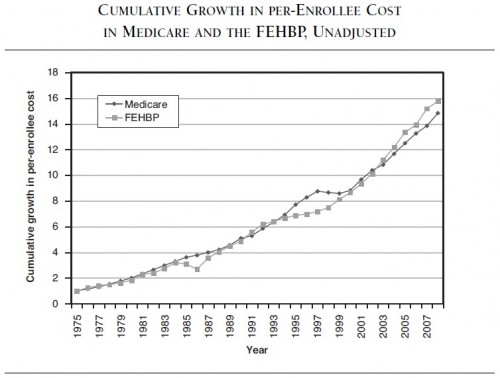
Here are the two charts from Walton Francis’s book that I presented in my post this morning. If you haven’t already done so, go read that post for an explanation of them. I will not review it again here. Here’s chart 1:
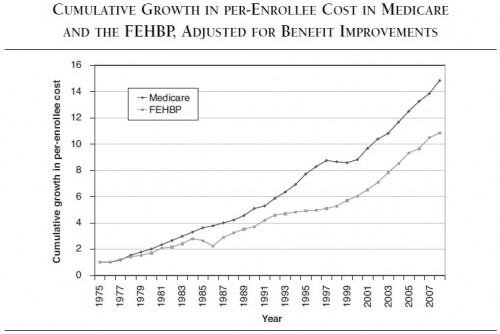
Let’s call the following “chart 2”.
What I focus on in this post is the fact that the two charts show two different things. That’s both obvious and subtle. The first chart above (chart 1) illustrates program cost growth for both FEHBP and Medicare. Since FEHBP premiums are not taxed and Medicare is, largely, tax financed, this is the chart of relevance to taxpayers. Which program has grown more? As we can see, it’s pretty much a wash.
Now consider the second chart (chart 2). If we presume that there is no (or negligible) enrollee cost growth for Medicare, then it is showing us a comparison of the benefits-adjusted rates of growth of the programs. Since Medicare and FEHBP have, essentially, the same unadjusted growth rate (as shown in chart 1), we can view the Medicare line in the second chart as a proxy for unadjusted FEHBP growth. With this in mind, what the second chart is illustrating is how much FEHBP benefits have grown in generosity. The gap between the two lines is a measure of that generosity growth. What it is showing is that program spending is growing (at about the rate of Medicare), and it is doing so in large part by “buying down” enrollee out of pocket costs. This is the chart an enrollee of the program should be interested in. He’s getting a great deal, and it gets better every year. (There is a big potential caveat to this. It’s in a footnote.*)
What I’m getting at is that the second chart is not really a pure cost control chart. It is an illustration of the increasing generosity of FEHBP. That generosity is occurring with no greater spending growth than Medicare, whose benefits are relatively stagnant. Consequently, FEHBP is becoming relatively more efficient in converting program dollars to benefits. That’s great for FEHBP enrollees. All things being equal, I’m happy for them to get a better and better deal. (I am, in fact, one of the enrollees in the program.) I’m disappointed Medicare is not attaining the same degree of efficiency for its beneficiaries.
But this conclusion about the superior program-revenue-to-benefits-conversion efficiency of FEHBP is not the same thing as superior program cost control. If I only cared about that (and that is what self-interested taxpayers who are not program enrollees should care about), I’d not want to see FEHBP getting more generous. Instead I’d want to see its spending growth to be lower relative to Medicare. The first chart shows that it isn’t. According to Francis’s analysis, on cost control alone, FEHBP is not outperforming Medicare. On efficiency of conversion of program dollars to enrollee benefits, it is.
We can rejoice about the efficiency of FEHBP, but we can’t say that it has better cost control relative to Medicare. To be sure, all else held constant, FEHBP would be even worse off if it was less efficient. By the same token, if Medicare were as (increasingly) efficient as FEHBP, the program could save a considerable sum. From that perspective, efficiency is playing a behind the scenes role in cost control. But we can also say that one possible consequence of the design of FEHBP is that it is voracious in its benefits enhancement. Instead of holding benefits at constant levels or letting them increase a bit, it has allowed them to grow to the point that it has traded away its efficiency advantage relative to Medicare.
In his Putting Medicare Consumers in Charge: Lesson from the FEHBP, Walton Francis covers a lot of issues and angles that I did not have space to get to in this post or the prior one. It is a must read for anyone interested in FEHBP, Medicare, and the interplay between the two.
* There is a hidden assumption here. It’s that some of FEHBP program spending is not in lieu of wages. If we were talking about a private sector firm, I’d reject this assumption. Studies have shown that premiums come at the expense of wages dollar-for-dollar, in the long run. But this is the federal government, which has a regulated pay schedule. To the extent the pay schedule is adjusted to reflect fringe benefits, including health care, then some of what I’ve written in this post is not correct. If/when warranted, I will post an update. However, I have asked several health economist who know the literature very well and they all say this has never been studied for the federal workforce. They also find it plausible that federal wages are stickier than private ones.


