
Including Santa Fe High School, I count 32 deaths from school shootings so far in 2018. It’s a shocking number. Nevertheless, school shootings are an uncommon cause of death. What has received less attention are the high overall mortality rates for US children and youth. I want to examine these deaths and then comment on the light they shed on US population health.
Here’s why I think that too many US children die. In Health Affairs, Ashish Thakrar and colleagues analysed US infant (birth to the first birthday) and child (1-19 years old) mortality rates (hereafter, I’ll say pediatric to refer to both age groups). They compared these mortality rates to 19 peer countries* in the Organisation for Economic Co-operation and Development (OECD). Thakrar et al. estimated age-specific mortality rates from the pooled OECD data. They then applied these age-specific OECD mortality rates to the age-structure of the US pediatric population, for the years 1960-2010. This allowed them to calculate the number of deaths that would have occurred in the US during these years if, counterfactually, the US had had the mortality rates of the OECD. The counterfactual death counts based on the OECD mortality rates were lower which, conversely, meant that the US had an excess of pediatric deaths. Thakrar:
The United States has poorer child health outcomes than other wealthy nations despite greater per capita spending on health care for children… While child mortality progressively declined across all countries [from 1960 to 2010], mortality in the US has been higher than in peer nations since the 1980s. From 2001 to 2010 the risk of death in the US was 76 percent greater for infants and 57 percent greater for children ages 1–19.
Childhood mortality has been falling in the US and the OECD throughout this period. Epidemiologists saw this and celebrated the progress. What they didn’t notice was that, as the graph shows, mortality rates weren’t falling as fast in the US as in the rest of the OECD.
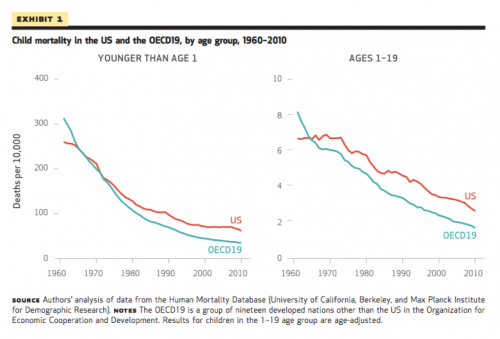
To appreciate what this difference means, it’s helpful to convert rates into counts. We’ll focus on the most recent period, from 2001 to 2010. US infants had a mortality rate of 68.8 deaths/10,000 infants during this decade, but the OECD infant mortality rate was only 39.0 deaths/10,000 infants.§ So,
Excess Infant Deaths/10,000 = 68.8 Deaths/10,000 – 39.0 Deaths/10,000
= 29.8 Excess Infant Deaths/10,000.
This is a small probability: 29.8 Excess Infant Deaths/10,000 is an additional probability of 0.00298 that an infant will die.
So, how many excess infant deaths are there? It turns out that small probabilities can have big consequences. There are about four million children born in the US each year. Therefore,
Excess US Infant Deaths = Probability(An Excess Death)/Year × Infant Population
= 0.00298/Year × 4 million Infants = 11,920 Excess Infant Deaths/Year.
Likewise, the US mortality rate for children aged 1-19 years, 3.1 deaths/10,000 children, was higher than the 2.0 deaths/10,000 children that would have occurred if the US had had the OECD child mortality rate. This means there were 1.1 Excess Child Deaths per 10,000 children. There are 76 million children aged 1-19 years during any given year, so
Excess US Post-Infant Deaths/Year = 0.00011 × 76 million Children 1-19
= 8,360 Excess Child Deaths/Year.
Finally,
Excess Pediatric Deaths/Year = 11,920 Infants + 8,360 Children
= 20,280 Pediatric Deaths/Year.¶
This is greater than the number of AIDS deaths each year. It’s about half the number of motor vehicle deaths (for all ages). Hurricane Katrina caused 1,833 deaths. If we scale excess pediatric deaths in Katrina units, then the annual excess US pediatric deaths comprise just over 11 Katrinas.
However, the comparison to Katrina understates the problem. This is because the children who suffered excess deaths were about five years old when they died, on average. At that age, the Social Security Administration estimates that they had 74 years of life expectancy remaining. Call this Years of Life Lost/Death or YLL. The Katrina victims were on average 69 years old when they died. At that age, Social Security estimates that they lost 16 years of life.
If so, then the Total Years of Life Lost (TYLL) for Katrina was
TYLL(Katrina) = Katrina Deaths × YLL(Katrina)/Death
= 1,833 Deaths × 16 Years Lost/Death
= 29,328 Years.
Whereas for excess US pediatric deaths, we have
TYLL(US Pediatric) = Excess Pediatric Deaths × YLL(US Pediatric)
= 20,280 Deaths × 74 Years Lost/Death
= 1,500,720 Years.
If you want to recall one number from this, it might be that there are 1.5 million years of life lost each year due to excess pediatric deaths. Or, roughly, 70 Katrinas.
Now, how should we interpret these calculations? They are dependent on our choice of a benchmark and several assumptions. No one went out and determined whether a given dead child was an expected or excess death. You should attach wide error bars to these numbers. Nevertheless, the magnitude of the number of excess US pediatric deaths is huge and will remain large even if we substantially shrink these numbers to reflect our uncertainty.
This is more evidence that US population health is far worse than it should be. Recent discussions of US mortality have focused on alarming increases in opioid deaths, adult mortality in economically deprived areas, and a decrease in overall life expectancy. Large numbers of excess pediatric deaths are part of this story.
There is no single cause for this. The US fell behind the OECD in reducing pediatric mortality rates in the 80s and has stayed there since, across many administrations, so there is no reason to make this a partisan issue. We should just study the causes of infant and child mortality and address them. Thakrar:
Policy interventions should focus on infants and on children ages 15–19, the two age groups with the greatest disparities [between the US and the OECD in cause-specific mortality rates], by addressing perinatal causes of death, automobile accidents, and assaults by firearm.
We could approach this as litigation for or against the United States, debating whether Americans have, collectively, neglected their children. But this makes little sense. Excess deaths are inferred, not witnessed. Let’s view this as an opportunity: We have discovered that each year there are 20,000 lives that could be saved.
*The OECD comparison countries were Australia, Austria, Belgium, Canada, Denmark, Finland, France, Germany, Iceland, Ireland, Italy, Japan, the Netherlands, New Zealand, Norway, Spain, Sweden, Switzerland, and the United Kingdom. Canada, by the way, also performs worse than the OECD average, although better than the US.
§Unfortunately, the deaths of premature infants are counted differently in the US and some other countries. Some countries do not count the deaths of infants with very low gestational age (e.g., 24 weeks or earlier) as infant deaths, whereas the US does. This problem will tend to inflate the estimated number of excess infant deaths. Thakrar et al. acknowledge this problem, but they could not correct it using the available data. However, CDC analyses show that the US has higher infant mortality even after adjusting for this. There would be substantial numbers of US excess infant deaths, even if this problem could be corrected.
¶Many analysts argue that calculations of YLL should not use the raw life expectancy that a person had at the time of their premature death, but rather a life-expectancy that discounts the value of future years of life, conventionally at a rate of 3%/Year. For discount rate r and undiscounted life expectancy K, the formula for calculating this is
Discounted(YLL) = ∑ (1 + r)–k,
where the summation is from k = 0 to K – 1. Using this, Discounted YLL(Katrina) = 12.9 Years/Death. This means that
Discounted TYLL(Katrina) = 23,751 Years.
Carrying out a similar calculation for US children, we have
Discounted TYLL(US Pediatric) = 618,418 Years.
Then the annual total years of life lost due to excess US child deaths, in discounted years, is 26 Katrinas.
