
US life expectancy at birth declined for the second year in a row, by an estimated -0.1 years (-0.2 years for males, no change for females). When you use a small number to describe an event, it suggests that the consequences of the event are negligible. This is an illusion: the drop in life expectancy is a catastrophe. I’ll show this by translating that decrease into numbers that appropriately convey the magnitude of harm.
Let’s work through a series of questions about the CDC report.
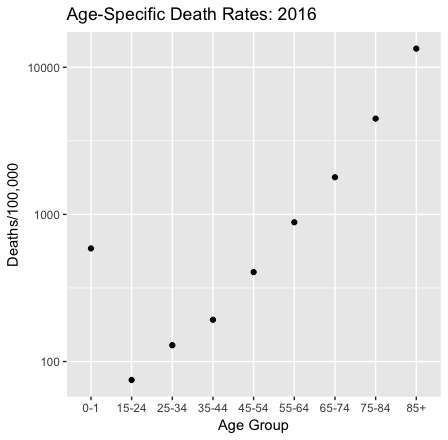
First, what is life expectancy? Life expectancy at birth is the number of years that a newborn should expect to live, assuming age-specific mortality rates remain at their current levels. There’s a lot packed into this definition.
Age-specific death rates determine life expectancy. So if life expectancy changes it is because death rates changed. Death rates vary by age group: they are moderately high for infants, drop during childhood, and then rise as we age.
Some calamities raise death rates across the lifespan, such as the flu epidemic at the end of the first world war. But if we compare 2015 and 2016 death rates, that isn’t what happened.
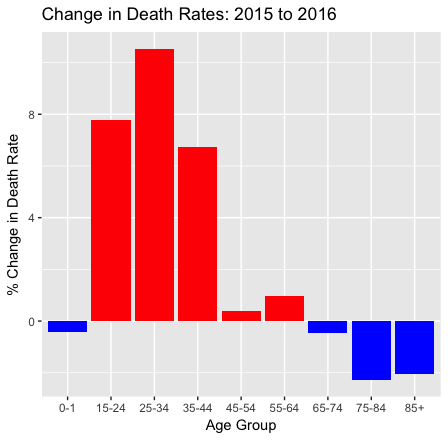
The blue bars show that for infants and the elderly, death rates fell. In fact, life expectancy improved for those 65 and older. But for everyone else death rates rose, and for young adults, they rose a lot. Moreover, the changes in age-specific death rates varied by race, gender, and (the CDC report doesn’t discuss this, but it’s true) the region of the US. The net effect of the changes in age-specific death rates across the lifespan and the population was a -0.1-year change in life expectancy at birth.*
Does a small decline in life expectancy matter? The change of -0.1 years/life is a -0.13% decline from the 2015 US life expectancy at birth (78.7 years). This is how your individual life prospects changed if you are an infant who happened to be born in 2016 instead of 2015. And, yes, those prospects only diminished a little.
But that’s not the only way to look at this: We should also look at the cumulative loss of life across the population.** Consider that for one birth cohort,
-0.1 years/infant × 4 million annual births = -400,000 years/cohort.
How large was that loss? There were 4,424 US deaths in the Iraq war. These men and women were on average about 26 years old at the times of their death. Life expectancy at 25 is 55 years, so let’s say that that’s how much life they lost, on average. Hence
4,424 deaths in Iraq × -55 years/death ≈ -243,000 years lost in Iraq.
Therefore the expected years of life lost for a single birth cohort due to the changes in death rates from 2015 to 2016 was larger than the years of life lost by Americans in the Iraq war.
The traditional monetary value of a year of life in cost-benefit analyses is $50,000, but a more reasonable contemporary value might be $100,000. If so, then the value of a -0.1-year change is
-400,000 years/cohort × $100,000/year = -$4 trillion/cohort.
How big is that? Well, the value of goods and services produced annually in the US is $19 trillion. The total value of US real estate is about $30 trillion. So the monetary value of a small change in life expectancy for a single cohort was within one order of magnitude of astronomically valuable things such as the stock of US real estate or annual US GDP.
What happened to raise the death rates of Americans aged 15-64? I don’t have a breakdown of the causes of death by age in 2016, but for the population as a whole, suicides rose 2%, unintentional accidents increased 10%, and drug overdose deaths rose by a stunning 21% from 2015 to 2016. These causes contribute significantly to overall mortality for people in this age group, and they likely played a role in the increased death rates. These causes of death are all to some degree preventable, but what are we doing about them? I cannot help but note that although the President has declared an opioid emergency there has been no visible public health action on this issue.
Why is this loss of life difficult to see? First, it’s hard to see because the individual deaths are scattered across the country, and they aren’t connected by a single cause.
Second, policymakers and commentators focus excessively on economic indicators when they measure national well-being. The monthly Bureau of Labor Statistics jobs report is a news event in a way that a release of CDC mortality data is not. These economic data matter, but they are not a proxy for national well-being. US employment rose in 2016, and so did the Gross Domestic Product. Nevertheless, death rates rose sharply for working-age Americans.
So how should we assess national well-being? The French government’s Commission on the Measurement of Economic Performance and Social Progress (led by Joseph Stiglitz, Amartya Sen, and Jean-Paul Fitoussi) argued that
our [national] measurement system [should] shift emphasis from measuring economic production to measuring people’s well-being.
Measurements of well-being should include measures of population health, although we need to work through the conceptual challenges of such measures. The UN’s Human Development Indices (HDIs) do not work for me because they take years of schooling completed by students as a proxy for what they know. But the HDIs at least include life expectancy, and that’s a start.
*Keep in mind that the definition of life expectancy assumes that age-specific mortality rates will remain the same. That implies that when babies born in 2016 turn 34 in 2050, their age-specific death rate will be 129/100,000, the same as in 2016. However, death rates change from year to year (as we have just seen), so it’s unlikely that the age-specific death rates will stay constant as the 2016 birth cohort ages. Therefore, life-expectancy at birth is an uncertain predictor of how long an infant born today will live, although we do not have a better one. However, it is a good summary measure of the current force of mortality across the lifespan.
**Taking the population instead of the individual view of mortality is precisely John Donne’s point in his Meditation XVII (1624):
No man is an island entire of itself; every man
is a piece of the continent, a part of the main;
if a clod be washed away by the sea, Europe
is the less, as well as if a promontory were, as
well as any manner of thy friends or of thine
own were; any man’s death diminishes me,
because I am involved in mankind.
And therefore never send to know for whom
the bell tolls; it tolls for thee.
