I know this is outside of my usual wheelhouse, but I’ve been playing with the FRED Plug-In for Excel (h/t Jared Bernstein). It has tons of up-to-date data, and allows for easy graphing.
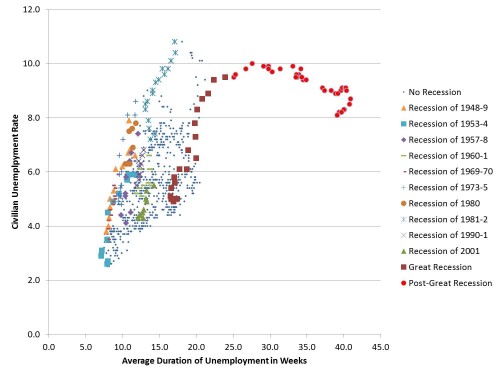
So I made this nice chart showing how the unemployment rate has varied with how long people are unemployed over time. FRED let me easily import monthly data since 1948. I’ve coded all the recessions in that time period, including the most recent “Great Recession”, and the time since that ended. Please, someone, tell me how we’re not screwed.
I’m old enough to remember the recession of 1981-1982. Unemployment peaked at 10.8%, higher than at any time in the recent badness. But even at its worst, the average time an American was unemployed was barely over 21 weeks. And that was the worst recession before this one. In the midst of this recession, the average time an American was unemployed was about 20 weeks. When the recession “ended”, it was 25 weeks. And in the “good” times since the recession has been over, the average time an American was unemployed has only gone up, to a peak of 40.9 weeks, and settling at 39.7 weeks last month.
The amount of time an American is unemployed recently is unprecedented since 1948. It just looks so bad. Someone make me feel better.


