By email Brad Flansbaum drew my attention to Geographic Variation in Health Care: Changing Policy Directions, by Jill Bernstein, James Reschovsky, and Chapin White from the Center for Studying Health System Change (ungated). It’s a very good summary of what is known and not known on this topic. It explains how and why some have misinterpreted the evidence on geographic variation in health spending. If you’ve been following work in this area, you’ll know that the story is more complex than most think. If you haven’t been, this paper is a great place to start.
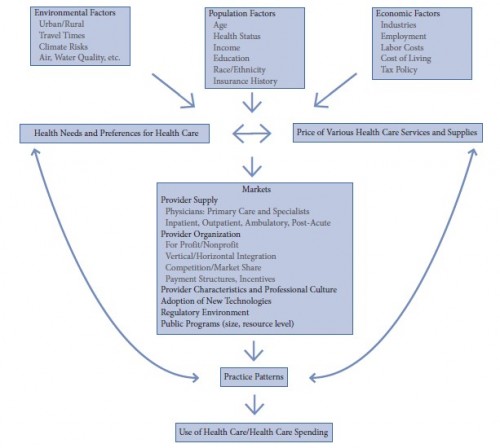
The paper includes the following conceptual model of the determinants of health care use. Because the diagram is circular (arrows flowing back from “practice patterns” to “health needs and references for health care” and “price of various health care services and supplies”) estimating causal effects is difficult. For this and other reasons, we do not yet have a good handle on how geographic variations in health care arise and how much of it is associates with wasteful care.
However, we do know some things. As the authors write,
The best available research does not provide a solid basis for drawing conclusions about how much of the variation in Medicare spending across localities reflects inappropriate or inefficient spending. […]
Fee-for-service payment poses an obvious obstacle to reducing inappropriate or marginally effective care. […]
Cutting reimbursement alone will not automatically make high-spending areas adopt the systems, culture, and experience of low-spending areas.
In other words, not only are current FFS-based payments not helpful in eliminating wasteful health spending, the standard approaches to cutting spending — by cutting reimbursements — is not likely to work. The problem isn’t reimbursement levels but something about the (local) system they finance.
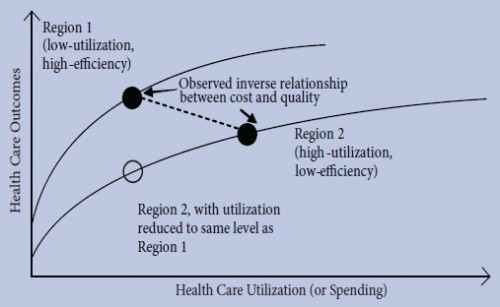
The paper explains this with a model proposed by the Congressional Budget Office that considers two regions (see the figure below). Region 1 has low utilization (low spending) and high efficiency (i.e., very little low effectiveness care is provided). Region 2 has high utilization (high spending) and low efficiency (i.e., a lot of care that is not very effective is provided). The two regions have different health outcomes production functions. That is, the relationship between health care utilization (spending) and outcomes is different in the two regions.
Suppose we observe health spending and outcomes for both regions at a point in time and find that spending and outcomes are represented by the black dots. Since spending is higher in region 2 than 1 but outcomes are worse, we might conclude that higher spending produces worse health outcomes. We would conclude that if we were not aware that the two regions had different production functions. However, if we believed that higher spending produced worse outcomes, then the policy solution is to reduce reimbursements in region 2.
Suppose we reduced reimbursements so that region 2 had the same utilization level as region 1. That would shift region 2 to the empty circle in the figure. However, at that point, region 2’s outcomes are even worse than they were to begin with. In other words, cutting reimbursements does reduce utilization, but it does so in a way that is harmful to outcomes.
The challenge is to reform policy to reduce spending while not harming outcomes (and, hopefully, improving them). A naive interpretation of geographic variations does not suggest the right reform. Simply spending less does is not the right approach.


