
There’s a ridiculously fantastic manuscript over at JAMA that you should go read right now. “The State of US Health, 1990-2010: Burden of Diseases, Injuries, and Risk Factors“:
Importance Understanding the major health problems in the United States and how they are changing over time is critical for informing national health policy.
Objectives To measure the burden of diseases, injuries, and leading risk factors in the United States from 1990 to 2010 and to compare these measurements with those of the 34 countries in the Organisation for Economic Co-operation and Development (OECD) countries.
Design We used the systematic analysis of descriptive epidemiology of 291 diseases and injuries, 1160 sequelae of these diseases and injuries, and 67 risk factors or clusters of risk factors from 1990 to 2010 for 187 countries developed for the Global Burden of Disease 2010 Study to describe the health status of the United States and to compare US health outcomes with those of 34 OECD countries. Years of life lost due to premature mortality (YLLs) were computed by multiplying the number of deaths at each age by a reference life expectancy at that age. Years lived with disability (YLDs) were calculated by multiplying prevalence (based on systematic reviews) by the disability weight (based on population-based surveys) for each sequela; disability in this study refers to any short- or long-term loss of health. Disability-adjusted life-years (DALYs) were estimated as the sum of YLDs and YLLs. Deaths and DALYs related to risk factors were based on systematic reviews and meta-analyses of exposure data and relative risks for risk-outcome pairs. Healthy life expectancy (HALE) was used to summarize overall population health, accounting for both length of life and levels of ill health experienced at different ages.
I’m a health services researcher, and I’m obsessed with outcomes. One of the first major projects of this blog was a two-week series on quality in the US health care system. I’ve written numerous times about what kills us. This study specifically looked at the burden of disease, injuries, and risk factors in the US versus other countries. The methods are amazingly detailed.
So how did we do compared to other countries? Not well. Between 1990 and 2010, among the 34 countries in the OECD, the US dropped from 18th to 27th in age-standardized death rate. The US dropped from 23rd to 28th for age-standardized years of life lost. It dropped from 20th to 27th in life expectancy at birth. It dropped from 14th to 26th for healthy life expectancy. The only bit of good news was that the US only dropped from 5th to 6th in years lived with disability.
There’s a chart I’d like to highlight. This is the rank of age-standardized years of life lost rates among the 34 OECD countries in 2010. The numbers in each cell show the rank of the country in years of life lost for each cause (1 is best). The countries are sorted overall on age-standardized all-cause years of life lost. The colors show if the age-standardized years of life lost for a country is significantly lower than the mean (green), indistinguishable from the mean (yellow), or higher than the mean (red) for all OECD countries (click to enlarge):
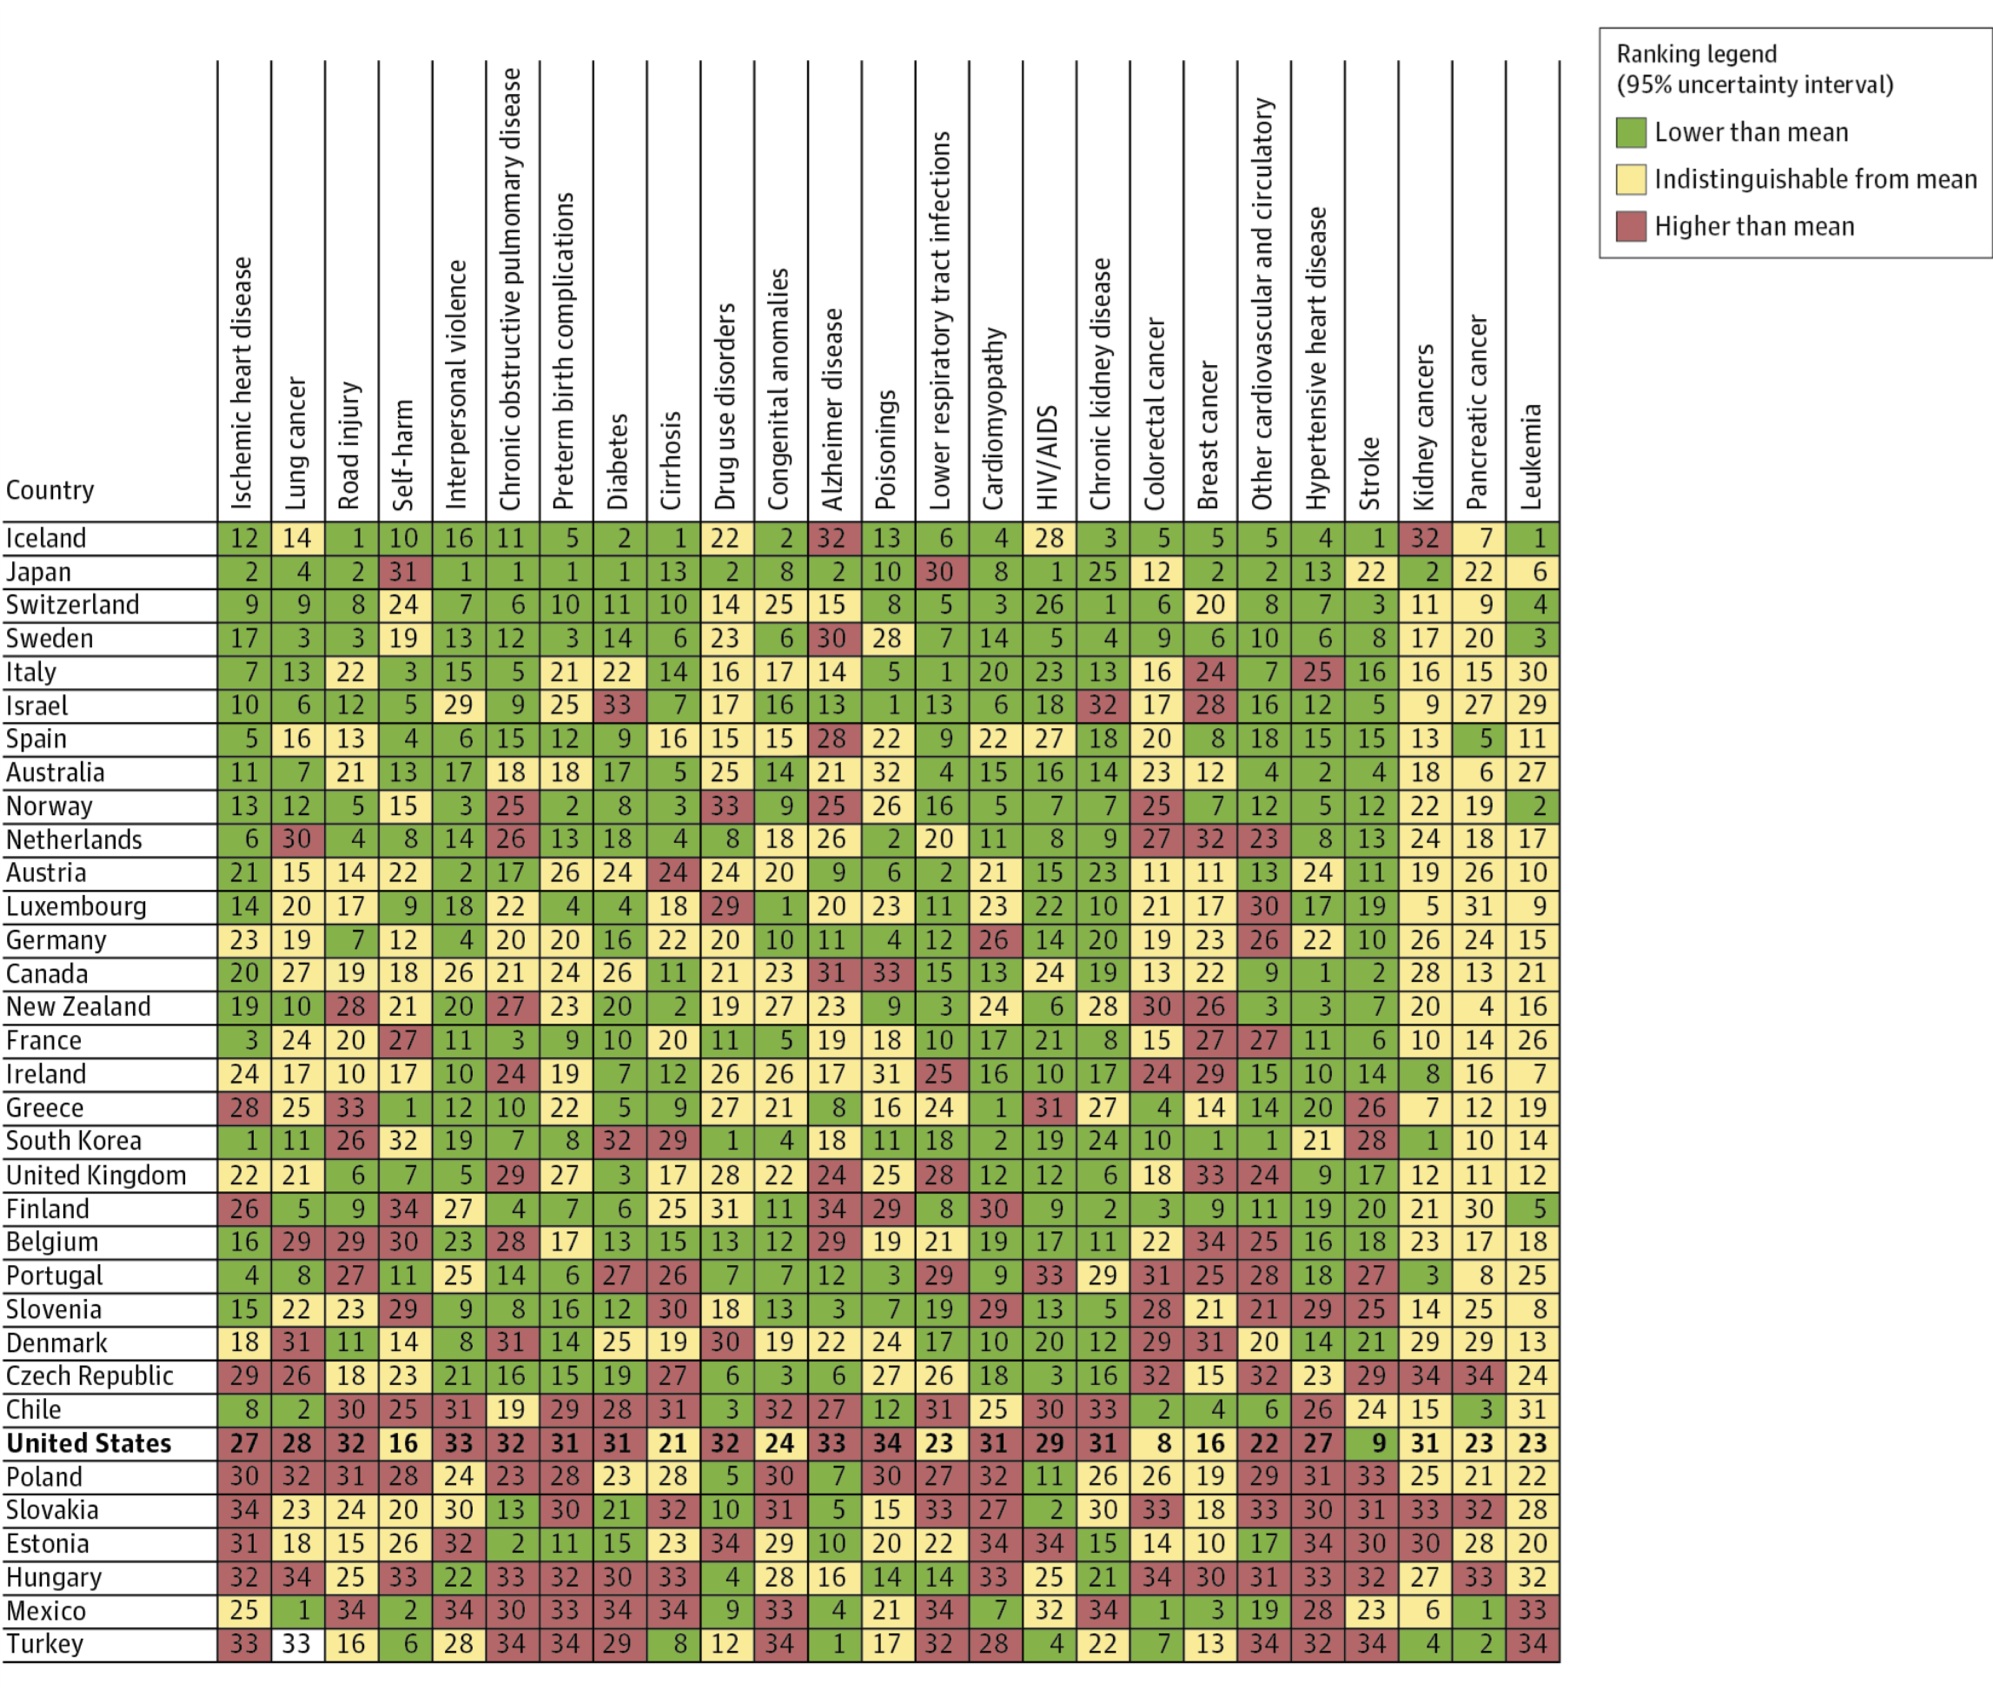
Things don’t look so good for the US. There’s an awful lot of red there. A little bit of yellow. One green. Best in the world, my ass.
Some of you will feel the urge to blame this on the racial or ethnic makeup of the US. I encourage you to look at the variety of causes of years of life lost. They don’t favor just one group. They’re all over the place. And we do pretty badly in most of them.
I want to highlight one more table. It’s the deaths and years of life lost for the 30 leading diseases and injuries that contribute to overall years of life lost in the United States in 1990 and 2010. They’re ranked by the size of the relative contribution to overall years of life lost. In other words, those at the top cause the most years of life lost in the US, and those at the bottom the least (click to enlarge):
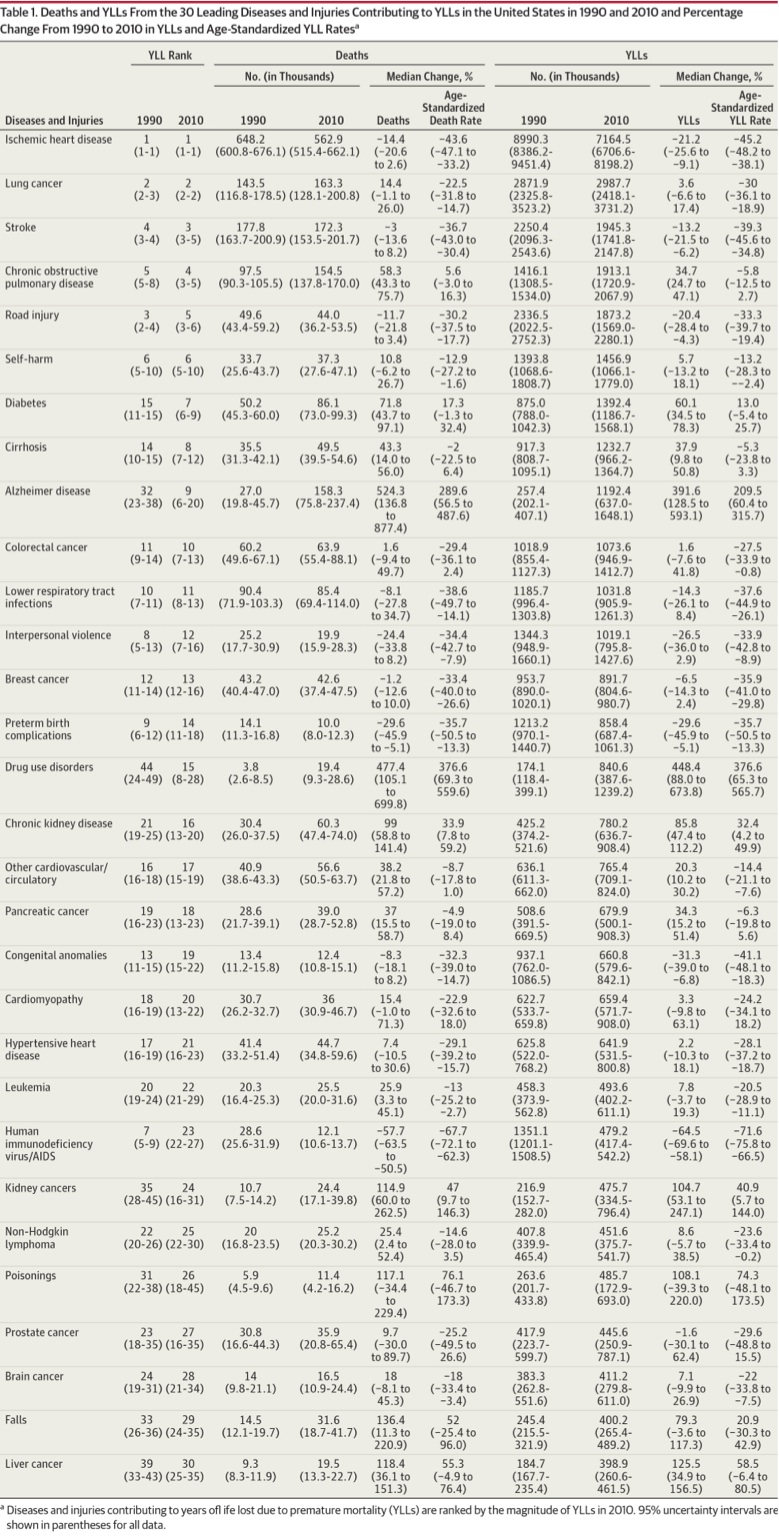 What we have here is a prioritization issue. We spend a lot of time worrying about colon cancer. It’s ranked 11th in 2010. We spend a lot of time worrying about breast cancer. We have walks, and ribbons, and whole months dedicated to it. It’s ranked 13th. Prostate Cancer? Men are obsessed with it. It’s ranked 27th. But more years of life are lost to lung cancer than to prostate cancer, colon cancer, and breast cancer combined. Ischemic heart disease causes four times as many years of life to be lost each year as prostate cancer, colon cancer, and breast cancer combined. Stroke is 3rd. COPD is 4th. Traffic accidents are 5th. Suicide is 6th. None of these things get the national attention, or resources, that they deserve.
We could have the best health care system in the world. We’ve got the money and the necessary pieces to get really, really good outcomes. But we need to be much smarter about it if we’re going to do so.
