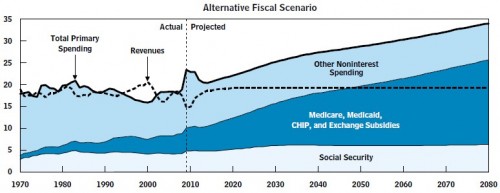
A big tip of the hat to Brad DeLong for drawing my attention to CBO’s most recent federal revenue and spending projections. He focuses on one set of graphs, but I’m interested in another, though they essentially tell the same story. This first one should look somewhat familiar as I think this is the fourth time I’ve posted graphs like this:
Federal Revenue and Spending Projection as a Percent of GDP (Source: CBO, 2010)
First of all, I think CBO blew it in constructing the graph. The “Other Noninterest Spending” area should have been on the bottom, “Social Security” in the middle and “Medicare, Medicaid, etc.” on top. When organized that way, as it was in the past, it really illustrates where the bloat is. (Hint: it’s not in Social Security or other noninterest spending).
Second, one must say what “Alternative Fiscal Scenario” is, so I will. It is not the CBO Baseline Scenario (that’s below). Thus, it is not fully based on current law but assumes Congress will behave more like it has in the past and undo some of the aspects that current law would otherwise bind us to do. In particular,
[T]he alternative fiscal scenario, which incorporates several changes to current law that are widely expected to occur or that would modify some provisions of law that might be difficult to sustain for a long period. In this scenario, CBO assumed that Medicare’s payment rates for physicians would gradually increase (which would not happen under current law) and that several policies enacted in the recent health care legislation that would restrain growth in health care spending would not continue in effect after 2020. In addition, under the alternative scenario, spending on activities other than the major mandatory health care programs, Social Security, and interest would fall below the average level of the past 40 years relative to GDP, though not as low as under the extended-baseline scenario. More important, CBO assumed for this scenario that most of the provisions of the 2001 and 2003 tax cuts would be extended, that the reach of the alternative minimum tax would be kept close to its historical extent, and that over the longer run, tax law would evolve further so that revenues would remain at about 19 percent of GDP, near their historical average.
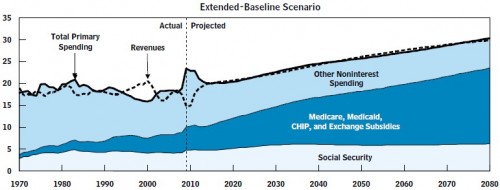
These are pessimistic but not altogether unreasonable assumptions. Nevertheless, one can’t know for sure that future Congresses will be as week-kneed as have been prior ones. Maybe you’d like a different assumption. How about assuming Congress sticks with current law and continues with PAYGO? Well, then things look better and we arrive at CBO’s Baseline Scenario:
Federal Revenue and Spending Projection as a Percent of GDP (Source: CBO, 2010)
Wow! That looks better. Not great. But better. We still have some hefty growth in federal health spending, paid for by a growth in revenue (taxes). One might rather see that money be spent in other ways, perhaps. One might wish the federal budget not grow to such a large proportion of the economy, maybe. But, at least the debt is not exploding in this scenario. And, what is this scenario exactly? you may ask. The CBO explains,
[T]he extended-baseline scenario, adheres closely to current law. It incorporates CBO’s current estimate of the impact of the recently enacted health care legislation on revenues and mandatory spending. [It includes t]he expiration of most of the tax cuts enacted in 2001 and 2003 [and] the growing reach of the alternative minimum tax.
Brad DeLong further explains that much of the reduction in growth in federal health spending in the Baseline Scenario relative to the Alternative Fiscal Scenario is due to the “IPAB [Independent Payment Advisory Board] that puts a brake on the growth of Medicare costs, and the excise tax on high-cost health plans that raise revenue.” In other words, assuming the ACA’s provisions work, among many other things, gets your a relatively rosy scenario.
What scenario will we really get? Not either of these, I assure you. At best, I think it’ll be something in between. In terms of health care inflation, I’d prefer that we attain a trajectory closer to the baseline version than the debt-busting alternative. Actually, I’d like to see health care inflation come down even lower than the baseline version suggests. That’s because there’s no historical post-war precedent for taxation levels that support government revenue above 20% of GDP, and we can’t take on much more debt.
Thus, I advocate keeping the heat on Congress and the focus on costs. Take your eye off this ball for long and I am certain someone–some industry–will find a way to sneak off with a tad more taxpayer money than you might prefer.


