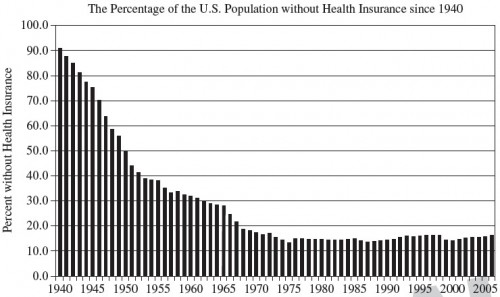
So I could quote text and excerpt figures, Rex Santerre kindly sent me electronic versions of chapters of his textbook, Health Economics: Theories, Insights, and Industries Studies, co-authored with Stephen Neun. I’m going to gradually comb through it. I began moments ago with Chapter 1 and the following figure caught my eye.
Two things to note, both of which I (and likely you) already knew:
- Health insurance is largely a post-war phenomenon. Between 1940 and 1970 the uninsurance rate fell by 75 percentage points. Thirty years of amazing progress. Wow!
- Essentially no reduction in the uninsurance rate has occurred since 1970. It’s fluctuated a bit but stayed pretty close to 15%. Forty years of zero progress. Wow!
And then we passed the ACA. In four years there will (or should be) a major new feature in graphs like this. The graph helps us see that on the problem of access–and health insurance does facilitate access to care–the ACA is a big milestone. Historic.
(Insert usual disclaimer that the ACA does not do enough on cost and quality.)


