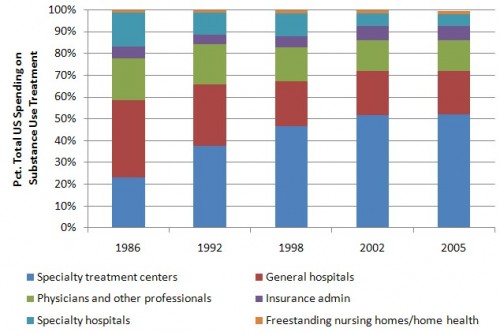
Lately, I’ve published many posts on how much is spent on substance use treatment and prevention and where those funds come from (posts here, here, here, and here). In this post, I’ll begin to delve into where that money goes, by provider type. The following figure is based on the data in Exhibit 3 of the recent Health Affairs paper by Mark, et al. (see also the 2005 HHS report by some of the same authors).
The figure shows the breakdown of total spending by provider type. As such, it doesn’t show the total amount spent. It was (in millions of nominal dollars): $9,147 in 1986, $13,162 in 1992, $14,414 in 1998, $19,134 in 2002, and $22,175 in 2005. Clearly, there have been some very large changes in how we spend money on substance use treatment. The greatest shift has been a more than twofold increase in the proportion of spending on care in specialty treatment centers and a commensurate decline in spending on care in hospitals (specialty or general).
Corresponding to this shift to specialty treatment centers from hospitals, the proportions spent on inpatient, outpatient, and residential settings have changed. In 1986 they were 59% inpatient, 24% outpatient, and 17% residential. In 2005, those figures were 18%, 52%, and 30%, respectively.


