
The following is a guest post by Garret Johnson and Zoe Lyon, both research assistants for Dr. Ashish Jha at the Harvard T.H. Chan School of Public Health. Garret graduated from Brown University in 2014 with a degree in French. Zoe graduated from Kenyon College in 2015 with a degree in Religious Studies. Find them on twitter @garretjohnson22 and @zoemarklyon.
On January 27, CMS released a new guide to preventing readmissions among diverse populations, as part of its “Equity Plan for Improving Quality in Medicare.” This latest initiative represents a new chapter in the controversy over the hospital readmissions reduction program (HRRP), one of the many initiatives introduced by the ACA to improve U.S. healthcare quality. In effect since 2012, the HRRP aims to reduce costly readmissions by financially penalizing hospitals with “excess readmissions” by up to 3 percent of their total base DRG payments.
While the HRRP adjusts for age, sex and comorbidity differences across hospitals, there is now substantial evidence that high readmission rates — especially for medical conditions, as opposed to surgical ones — are driven more by patient factors outside of hospitals’ control (e.g. poverty, lack of social supports) than by hospitals’ quality of care and discharge planning. Studies show that patients who are poorer, sicker, and of racial minorities are readmitted at higher rates than other patients, which raises concern that the HRRP is simply punishing hospitals for the groups of patients that they serve. Advocates for the HRRP argue that the program removes the perverse incentive wherein hospitals get more money if patients are readmitted than if they are not, and that tying payment to readmissions is an effective way to hold hospitals accountable for discharge planning and care transitions. Though blunt, the penalties are forcing hospitals to think beyond their walls to ensure that patients receive effective care throughout their interaction with the healthcare system.
With its new guide to preventing readmissions in diverse populations, CMS seems to be acknowledging the issues with the readmission measure while attempting to take a leadership role in improving care for patients of low socioeconomic status. Accomplishing that and eliminating disparities in readmission rates is far better than adjusting them away. But, we should at least agree that disparities exist, and that patient factors matter.
Enter the latest paper on the subject, written by Steven Sheingold (director of the Division of Health Financing Policy at the Department of Health and Human Services) and colleagues in Health Affairs. Using Medicare data, the authors attempt to determine how much of the difference in readmission rates between safety-net (which they define as hospitals in the top 20 percent of disproportionate share or DSH ratio[1]) and non-safety-net hospitals (defined as all other hospitals) is due to observable hospital, patient and geographic area characteristics as opposed to unobservable factors, like the ever-elusive and complex “quality of care.” Sheingold et al. also present the level of penalties actually incurred under the HRRP by safety-net status, which they say “has received little attention.”
Without adjustment, they find that patients admitted to safety-net hospitals are 16 to 17 percent more likely to be readmitted than those admitted to other hospitals. Then, they sequentially adjust a logistic model of readmissions on safety-net status for:
- Age, sex, and comorbidities (the only covariates in the actual HRRP risk adjustment scheme)
- Socioeconomic status (race, dual eligibility, rural residence, traveling to an urban hospital)
- Admission characteristics (length of stay, discharge destination)
- Hospital characteristics (e.g. teaching status)
- Area characteristics (e.g. local unemployment rate)
After these adjustments, the differential between safety-net hospitals and other hospitals drops by 10 percentage points to 6 to 7 percent. As the authors put it, the observed factors listed above accounted for 60 percent of the increased likelihood of readmission at safety-net hospitals. It is important to note that the HRRP only adjusts for age, sex and comorbidities, meaning that a whole host of observable socioeconomic and other characteristics associated with increased readmission risk is not accounted for.
Using these adjusters, but this time applied to separate models for safety-net and non-safety-net hospitals, the authors find that even if safety-net hospitals treated the “easier” patients (those that are wealthier, less sick, and more likely to be white) that currently seek care at other hospitals, they would still have higher readmission rates. In other words, it’s not just the patient characteristics that are driving readmissions. Some underlying characteristic(s) (unobservable to us using these data sources) is causing higher readmission rates at hospitals that serve poor patients. The authors suggest that “quality of care” could be a key driving factor.
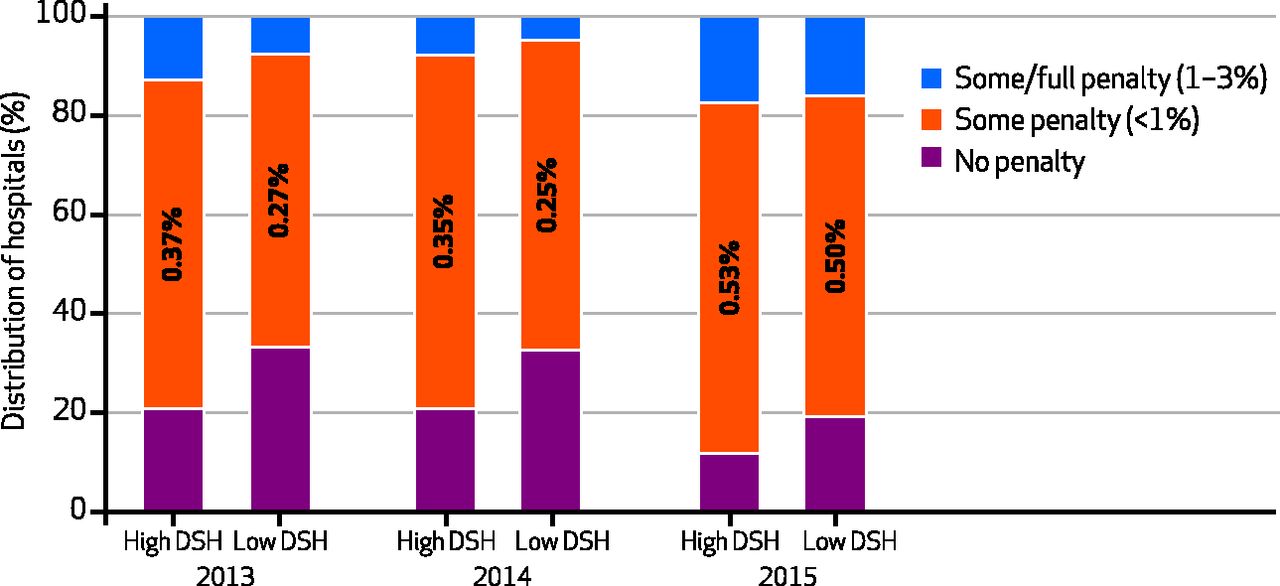
Finally, the authors show that the HRRP methodology for penalties has not resulted in dramatic differences in actual penalties incurred:
…few hospitals in either group received penalties of more than 1 percent in fiscal years 2013 or 2014. Moreover, the difference in mean penalty between the groups was 0.1 percent in [2013 and 2014] and 0.03 percent in fiscal year 2015.
We have a few concerns about this study. First, its definition of safety-net hospitals as the top 20 percent of DSH payment ratio and non-safety net hospitals as all others likely washes out some key differences that might exist between high- and how- DSH payment ratio hospitals. We’d like to see the study pitting the top 20 percent of DSH ratio hospitals against the bottom 20 percent. It also doesn’t seem to account for clustering of patients at the hospital level. In other words, the authors treat patients that visit different hospitals as all coming from one general population of patients, when in reality we know that certain sub-types of patients tend to cluster at certain hospitals (e.g. more complex patients generally end up at teaching hospitals). This effectively makes the model look like it has more data than it truly does, meaning that their standard errors are smaller than they should be.
More broadly, to the extent that this paper was meant to slow down and refocus discussions about adjusting the HRRP, we’re not sure that it is effective. The authors themselves note that “socioeconomic status as measured here explained approximately one-quarter of the difference in the odds of readmission that remained after accounting for the risk-adjustment factors that are a part of the HRRP.” If we know that these measurable markers of socioeconomic status are associated with higher readmission rates, no matter what the hospital does, why not adjust for them? Obviously we should aim to more effectively measure socioeconomic status (Medicare claims data are very disappointing in this regard) as the authors note in their discussion, but they do not put forward a good argument against adjusting for what we can today. The authors argue that the relative disparity in actual penalties in small, but they neglect to mention their finding that safety-net hospitals had about half the financial cushion (as measured by margins) as non-safety-net hospitals (+2.0% vs. +3.9%; see their Appendix). A small cut to Medicare payments might make a big difference to a struggling safety-net hospital, especially given that private payers are following CMS’ lead as they implement their own readmission penalties.
Essentially, we don’t really know the precise balance of hospital quality and patient factors that cause readmissions. On one hand, the federal government’s new guide to preventing readmissions among diverse patients suggests that differences in patient mix can seriously affect both readmission rates and prevention strategies. Yet this paper from Sheingold and colleagues makes the case that the current form of the HRRP is not as unfair to safety-net providers as it seems. We’re far less certain that’s the case.
[1] The DSH ratio is “based on the proportion of Medicare inpatient days attributable to patients eligible for Supplemental Security Income (SSI) and the proportion of total days attributable to Medicaid patients.”