
This is a guest post by J. Michael McWilliams, MD, PhD, Alan M. Zaslavsky, PhD, Bruce E. Landon, MD, MBA, and Michael E. Chernew, PhD.
The extent to which the Medicare Shared Savings Program (MSSP) has generated savings for Medicare has been a topic of debate, and understandably so—the program’s impact is important to know for guiding provider payment policy but is challenging to ascertain.
Prior studies suggest that accountable care organizations (ACOs) in the MSSP have achieved modest, growing savings.(1-4) In a recent study in Annals of Internal Medicine, Markovitz et al. conclude that savings from the MSSP are illusory, an artifact of risk selection behaviors by ACOs such as “pruning” primary care physicians (PCPs) with high-cost patients.(5) Their conclusions appear to contradict previous findings that characteristics of ACO patients changed minimally over time relative to local control groups.
We therefore undertook to review the paper and explain these apparently contradictory results.(1,3) We concluded that these new results do not demonstrate bias due to risk selection in the MSSP but rather are consistent with the literature.
Below we explain how several problems in the study’s methods and interpretation are responsible for the apparent inconsistencies. We provide this post-publication commentary to clarify the evidence for researchers and policymakers and to support development of evidence-based policy.
Approaches to Estimating Savings and Risk Selection in the MSSP
If the objective is to determine Medicare’s net savings from the MSSP, the key is to estimate the amount by which participating ACOs reduced Medicare spending in response to the program using an evaluation approach that removes any bias from risk selection and compares ACO spending with a valid counterfactual (as opposed to the program’s spending targets or “benchmarks” for ACOs). With this unbiased estimate of gross savings in hand, the net savings can then be calculated by subtracting the shared-savings bonuses that Medicare distributes to ACOs. If ACOs engage in favorable risk selection, it is unnecessary to quantify it to calculate net savings. As long as the evaluation methods used to estimate gross savings appropriately remove any contribution from risk selection, the net savings will accurately portray the savings to Medicare (the bonuses include any costs to Medicare from risk selection). Thus, an evaluation can yield a valid estimate of net savings while avoiding the pitfalls of attempting to isolate the amount of risk selection.
Taking this approach, prior studies have estimated the gross savings while minimizing bias from risk selection,(1-3) without directly measuring it. Through the end of 2014 (the study period examined by Markovitz et al.), prior analyses found modest gross savings of about 1.1% when averaged over the performance years among cohorts of ACOs entering the MSSP in 2012-2014.(2) Gross savings grew over time within cohorts and exceeded bonus payments by 2014, with no evidence that residual risk selection contributed to the estimated savings or their growth.
Importantly, these prior evaluations took an intention-to-treat approach that held constant over time the group of providers defined as MSSP participants, regardless of whether ACOs subsequently exited the program or changed their constituent practices or clinicians. In other words, by keeping membership in the ACO groups constant over time, these estimates excluded spurious savings that might appear if ACOs selectively excluded providers with sicker patients over time.
Taking an alternative approach, Markovitz et al. try to quantify risk selection by estimating gross savings under a “base” method that includes selection effects, and then modeling and removing selection effects under various assumptions.
Although appealing in principle and potentially illuminating of undesirable provider behavior, their base case approach introduces additional sources of bias (not just risk selection), so their initial estimates are not comparable to those from the previous studies. Moreover, the comparisons of their base estimates with estimates from subsequent models do not support their conclusions. The authors misinterpret the reductions in savings caused by the analytic modifications intended to address selection as evidence of selection, when in fact the modifications correct for other sources of bias that were addressed by prior studies but included in the authors’ base case.
In addition to this misinterpretation, the approaches to removing risk selection from estimates also are problematic. Before discussing the details of these methodological issues, we first review the incentives for selection in the MSSP, which must be understood to interpret the findings of Markovitz et al. correctly.
Incentives for Risk Selection in the MSSP
The MSSP defines ACOs as collections of practices—taxpayer identification numbers (TINs)—including all clinicians billing under those TINs; ACOs thus can select TINs but cannot select clinicians within TINs for inclusion in contracts. The MSSP accounts for changes in TIN inclusion each year by adjusting an ACO’s benchmark to reflect the baseline spending of the revised set of TINs.
Thus, ACOs do not have clear incentives to exclude TINs with high-cost patients in favor of TINs with low-cost patients. Doing so might improve their performance on utilization-based quality measures such as readmission rates, thereby increasing the percentage of savings they can keep (the quality score affects the shared savings rate), but the savings estimate should not increase. More generally, if there are some advantages to selecting TINs with low-risk patients, the associated reduction in spending should not be interpreted as a cost to Medicare of risk selection because the benchmark adjustments for changes in TIN inclusion should eliminate much or all of the cost to Medicare (and the gain to ACOs). Theory and prior empirical work would actually suggest advantages of including high-spending TINs, as ACOs with high spending should have an easier time generating savings and indeed have reduced spending more than other ACOs, on average.
An analysis attempting to quantify risk selection should therefore focus on changes in patients or clinicians after MSSP entry within sets of TINs—changes that ACOs have clear incentives to pursue (e.g., by encouraging high-cost patients within a TIN to leave [e.g. through referrals] or directing clinicians of high-cost patients to bill under an excluded TIN).(6) Failure to exclude changes in TIN inclusion from estimates of risk selection is analogous to not accounting for the Hierarchical Condition Categories (HCC) score in an analysis of risk selection in Medicare Advantage vs. traditional Medicare.
Problems with Analysis and Interpretation by Markovitz et al.
Difference-in-differences analysis
Markovitz et al. present a base analysis intended to produce the gross savings that would be estimated if one allowed changes in the composition of ACOs to contribute to the savings estimate. Such an analysis should compare spending differences between ACO and non-ACO providers at baseline with spending differences between the two groups after MSSP entry (a difference in differences), while allowing the provider and patient composition to change over time within ACO TINs.
But the statistical model (section D of the Appendix) omits controls for fixed differences between providers that would be observable at baseline (i.e., provider effects). Consequently, the estimate (the coefficient on “MSSPijqt”) is not interpretable as a difference in differences, and the characterization of this model as similar to “previous analyses” is inaccurate. Furthermore, the estimate suggests gross savings that are nearly five times greater than the prior estimate of 1.1% that the authors claim to have replicated—a 5.0% reduction in per-patient spending ([-$118/quarter]/[mean spending of $2341/quarter]) after only about 12 months of participation, on average (Figure 2B).
Subsequent models do include terms for patient or provider fixed effects (Figure 2B), constituting difference-in-differences analyses. Hence, the dramatic attenuation of the estimated spending reduction caused by introducing these terms does not demonstrate risk selection, but rather the correction of the omitted term in the base model. The base model is thus a misleading reference value for comparisons. The fixed effects adjust not only for within-TIN changes in clinicians or patients after MSSP entry (the potential selection effects of interest that Markovitz et al are trying to isolate) but also for fixed (baseline) differences between ACOs and non-ACO providers and within-ACO changes in TIN inclusion that are reflected in benchmarks and account for much of the turnover in participating clinicians.(7) The latter two sources of compositional differences do not reflect risk selection and did not contribute to prior estimates of savings.(1-3)
In a more appropriate base analysis that better resembles previous evaluations (the 4th model in Figure 2, panel B), Markovitz et al. include ACO fixed effects and hold constant each ACO’s TINs over time. Compared with the results of that analysis (-$66/quarter or -$264/year or -2.8%), the addition of patient or clinician controls to eliminate selection has effects that are inconsistent in direction and more modest in magnitude than when using the previous base case as the comparator (Figure 2B).
This set of findings does not support a conclusion that prior evaluations overstated ACO savings by failing to fully account for risk selection. In fact, the gross savings estimated by models with patient or clinician effects range from approximately 10% greater to over 3 times greater than the average gross savings estimated in a prior evaluation over the same performance years (i.e., 113-300+% × the 1.1% spending reduction noted above).(2) Thus, the interpretation of the results from this series of models is misleading and mischaracterizes their relation to the prior literature.
Even with adjustment for patient or provider effects, the difference-in-differences analyses remain problematic for at least two reasons. First, Markovitz et al. use the actual MSSP assignments (in some cases based on post-acute or specialty care use) only in the post-period for ACOs. They cannot use these for the control group or for the pre-period for either the ACO or comparison group because the assignment data are only available for ACOs in performance years and only for ACOs that continue in the program. This introduces a time-varying inconsistency in how utilization is used to define comparison groups.
Second, Markovitz et al. rely on within-patient or within-clinician changes (i.e., models with patient or clinician fixed effects) to isolate the MSSP effect on spending, net of selection, but doing so can introduce bias.(3) For example, if ACOs hired clinicians to perform annual wellness visits, this could shift attribution of single-visit healthy patients away from their PCPs, causing artifactual within-PCP spending increases and underestimation of savings.
Or, if a strategy for ACO success is to shift high-risk patients to more cost-effective clinicians better equipped or trained to manage their care, one would not want to eliminate that mechanism in an evaluation of savings. More generally, the patient or clinician fixed effects can introduce bias from time-varying factors that would otherwise be minimized in a difference-in-differences comparison of stably different cross-sections of ACO and non-ACO populations.
Markovitz et al report substantial differences in pre-period levels and trends and a differential reduction in hip fractures. But none of these imbalances were observed in previous evaluations that addressed provider-level selection by holding ACO TIN (or clinician) composition constant and assigned patients to ACOs and control providers using a method based only on primary care use and applied consistently across comparison groups and years.(1,3) Markovitz et al. imply that their findings for hip fractures should be interpreted as evidence of bias from risk selection in prior evaluations.
But MSSP evaluation by our group (3) found no differential change in the proportion of patients with a history of hip fracture among ACO patients vs. control patients from before to after MSSP entry (differential change in 2015: 0.0% with a sample baseline mean of 2.9%) and no emergence of a differential change in hip fractures over the performance years that would suggest selection. We did not report this specific result in the published paper because we conducted balance tests for numerous patient characteristics, including 27 conditions in the Chronic Conditions Data Warehouse (of which hip fracture is one) that we summarized with counts. We report this result here to correct the misleading conclusion by Markovitz et al. that their findings would have been found in our study. The finding of a differential reduction in hip fractures suggests bias only in their analyses and provides further evidence that Markovitz et al. did not replicate prior evaluations and thus cannot demonstrate that they overstated savings.
Instrumental variables analysis
Markovitz et al. also include an instrumental variables (IV) analysis, using differential changes in local MSSP participation surrounding a patient’s PCP (“MSSP supply”) to estimate the incentive effect without selection effects. We question the validity and conclusions of this analysis for reasons we can only state briefly here.
Specifically, the instrument should affect the outcome only by altering treatment assignment and should therefore not be affected by treatment. Yet, unlike a standard ecologic instrument that is unaffected by treatment assignment (e.g., where a patient lives), “MSSP supply” can be altered by a change in a patient’s assigned PCP, which can occur as a result of ACO exposure (e.g., from risk selection, the focus of the study). This calls into question the applicability of a key assumption in IV analysis.
In addition, the difference-in-differences model in which the instrument is deployed does not adjust for fixed differences in spending between PCP localities (and thus does not produce difference-in-differences estimates). Moreover, the results of this analysis suggest implausible spending increases of $588-1276/patient-year for ACOs entering in 2013-2014 (Appendix Figure 4). Acceptance of the instrument’s validity requires acceptance that participation in the MSSP caused these large spending increases.
Even if we accept the validity of the IV estimates, they are not comparable to the other difference-in-difference estimates because IV estimates pertain only to the population (the “switchers”) for whom treatment is determined by the instrument. Therefore, the comparisons cannot be interpreted as quantifying risk selection. By construction, increases in the local supply variable arising from MSSP entry by large hospital-based systems are larger, and ascribed to more patients, thereby giving the most weight to ACOs previously found to have no significant effect on spending, on average.(1-3)
Thus, comparing the IV estimates to estimates from the other models is analogous to comparing overall program effects with subgroup effects. The difference may reflect treatment effect heterogeneity as opposed to selection, and the authors have implicitly chosen a subgroup (large health system ACOs) that other work suggests is less responsive to MSSP incentives. Thus, estimates from the IV analysis suggestive of minimal savings would be consistent with the minimal savings documented in the literature for the group of ACOs to which the IV estimates are applicable.
We also note that the “adjusted longitudinal analysis” is again used as an inappropriate comparator for the IV analysis. It appears the imprecise IV estimates would not differ statistically from the estimates produced by the more appropriate base case with ACO fixed effects (Figure 2B).
Flow analyses
Finally, Markovitz et al. interpret flow of patients and clinicians entering and exiting the MSSP as evidence of “pruning.” These analyses, however, do not support inferences about selection because they lack a counterfactual (flow in the absence of MSSP contracts).
Flow analyses can be deceptive because the health characteristics of the “stock” of patients assigned to the ACO changes over time, too. An ostensible net change in risk suggested by differences between those entering and exiting may be completely consistent with a population that is stable over time if patients’ risk status in the stock changes in a way that offsets the flow imbalance.
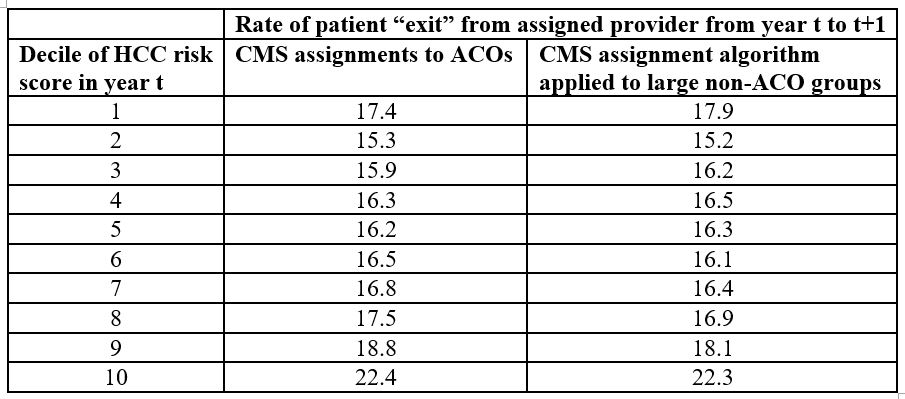
For example, Markovitz et al. previously interpreted greater “exit” of high-risk patients from ACOs as evidence of risk selection.(8) In the table below, we demonstrate that this conclusion is erroneous. The pattern of “exit” is merely an artifact of the utilization-based algorithm used to assign patients to ACOs. The higher switch rates among the highest-risk ACO patients (first column, based on CMS assignments of patients to ACOs) is similarly observed if one applies the CMS assignment rules to assign patients to large provider groups not participating in the MSSP (second column). Higher-risk patients receive care from more providers, causing more providers to “compete” for the plurality of a patient’s qualifying services in a given year and thus greater instability in assignment over time as the patient’s needs evolve. In other words, high-risk patients simply are reassigned more often, independent of ACO incentives.(9)
The comparisons of clinician entry and exit rates by Markovitz et al. are additionally misleading because of different denominators. If the probabilities in Figure 4 were calculated using a consistent denominator or instead reported as a replacement rate (high-risk patients served by entering physicians/high-risk patients served by exiting physicians), the higher spending associated with clinician exit and entry would be more similar.
Ultimately, if ACOs are “pruning” clinicians of high-cost patients, there should be evidence in the stock, but within-TIN changes in baseline risk scores of physician-group ACO patients have increased slightly, not decreased, relative to concurrent local changes.(1,3) The authors make no attempt to reconcile their conclusions with the documented absence of differential changes in ACO patient characteristics relative to controls. They make two contradictory arguments: that the savings estimated by prior studies were explained by selection on unobservable patient characteristics; but also that the risk selection is demonstrable based on observable patient characteristics (e.g., hip fracture, HCC score) that exhibited no pattern of selection in the prior studies.
Conclusion
Monitoring ACOs will be essential, particularly as incentives for selection are strengthened as regional spending rates become increasingly important in determining benchmarks.(10,11) Although there has likely been some gaming, the evidence to date—including the study by Markovitz et al.—provides no clear evidence of a costly problem and suggests that ACOs have achieved very small, but real, savings. Causal inference is hard but necessary to inform policy. When conclusions differ, opportunities arise to understand methodological differences and to clarify their implications for policy.
References
- McWilliams JM, Hatfield LA, Chernew ME, Landon BE, Schwartz AL. Early Performance of Accountable Care Organizations in Medicare. N Engl J Med. 2016;374(24):2357-66.
- McWilliams JM. Changes in Medicare Shared Savings Program Savings from 2013 to 2014. JAMA. 2016;316(16):1711-13.
- McWilliams JM, Hatfield LA, Landon BE, Hamed P, Chernew ME. Medicare Spending after 3 Years of the Medicare Shared Savings Program. N Engl J Med. 2018;379(12):1139-49.
- Colla CH, Lewis VA, Kao LS, O’Malley AJ, Chang CH, Fisher ES. Association Between Medicare Accountable Care Organization Implementation and Spending Among Clinically Vulnerable Beneficiaries. JAMA Intern Med. 2016;176(8):1167-75.
- Markovitz AA, Hollingsworth JM, Ayanian JZ, Norton EC, Yan PL, Ryan AM. Performance in the Medicare Shared Savings Program After Accounting for Non-Random Exit: An Instrumental Variable Analysis. Ann Intern Med. 2019;171(1).
- Friedberg MW, Chen PG, Simmons M., Sherry T., Mendel P, et al. Effects of Health Care Payment Models on Physician Practice in the United States. Follow-up Study. Accessed at: https://www.rand.org/pubs/research_reports/RR2667.html on March 29, 2019. 2018.
- Research Data Assistance Center. Shared Savings Program Accountable Care Organizations Provider-level RIF. Accessed at http://www.resdac.org/cms-data/files/ssp-aco-provider-level-rif on March 29, 2019.
- Markovitz AA, Hollingsworth JM, Ayanian JZ, Norton EC, Moloci NM, Yan PL, Ryan, AM. Risk adjustment in Medicare ACO program deters coding increases but may lead ACOs to drop high-risk beneficiaries. Health Aff (Millwood). 2019;38(2):253-261.
- McWilliams JM, Chernew ME, Zaslavsky AM, Landon BE. Post-acute care and ACOs – who will be accountable? Health Serv Res. 2013;48(4):1526-38.
- Department of Health and Human Services. Centers for Medicare and Medicaid Services. 42 CFR Part 425. Medicare Program; Medicare Shared Savings Program; Accountable Care Organizations–Pathways to Success and Extreme and Uncontrollable Circumstances Policies for Performance Year 2017. Final rules. Accessed at https://www.govinfo.gov/content/pkg/FR-2018-12-31/pdf/2018-27981.pdf on March 29, 2019.
- McWilliams JM, Landon BE, Rathi VK, Chernew ME. Getting more savings from ACOs — can the pace be pushed? N Engl J Med. 2019;380:2190-2192.