
This post was coauthored by Charles Roehrig, Ani Turner, and Katherine Hempstead. Charles Roehrig is the Altarum Institute Fellow and Founding Director of the Institute’s Center for Sustainable Health Spending. Ani Turner is the Co-Director of the Altarum Institute Center for Sustainable Health Spending. Katherine Hempstead is Senior Adviser to the Executive Vice President at the Robert Wood Johnson Foundation.
In a November 2015 Health Affairs blog post, we argued that expanded coverage was responsible for much of the increase in health job growth that we observed from the middle of 2014 through the middle of 2015. In this post, we carry our analysis forward to December 2016 and provide our best estimate of the total number of additional health jobs that are attributable to the expansion in health insurance coverage that began in 2014 under the Affordable Care Act (ACA). While for now, the American Health Care Act (AHCA) is dead, should it be resurrected and a portion of these coverage gains be reversed as projected by the Congressional Budget Office (CBO) in their scoring of the bill, we would expect a proportional reversal in these job gains.[i]
Coverage and Health Job Growth: National Data
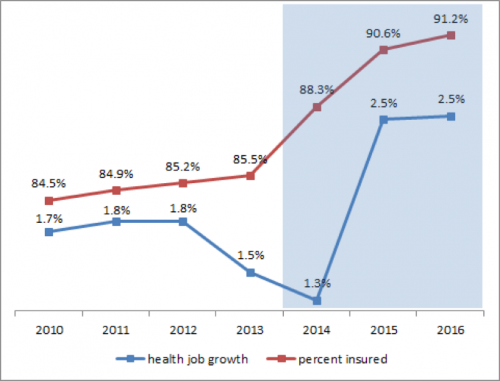
The percentage of the US population with health insurance increased slowly from 2010 to 2014 and then rose sharply in 2014 and 2015, coinciding with the expanded coverage provisions of the ACA that were introduced in 2014 (Figure 1). As expected, coverage began to level off in 2016 with a relatively small increase in the percent insured. Health job growth was stable through 2012, but dropped in 2013. Despite the jump in coverage, it dropped further in 2014, but then more than doubled in 2015.
Figure 1: Percent Insured and Health Job Growth (National Data for 2010 – 2016)
Source: Altarum Center for Sustainable Health Spending. Health job growth is estimated using U.S. Bureau of Labor Statistics (BLS) data while the percent insured is taken from the American Community Survey combined with CSHS analysis of Gallup poll data (for 2016). The shaded area represents coverage expansion under the Affordable Care Act.
What we expected. When coverage expands, the newly insured increase their overall utilization of health care and reduce their levels of uncompensated care. As a result, health care providers experience a growth in demand for care and in revenues. This should lead to increased hiring as they have both the need for additional staff and the means to pay. As expanded coverage levels off, these effects recede and hiring should return to normal growth rates.
What we saw. The patterns in Figure 1 are generally consistent with these expectations and reveal a lag between coverage and hiring. The greatest increase in coverage occurred in 2014 but the jump in the rate of hiring did not occur until 2015.[ii] This lag is not surprising, given the timing of coverage expansion (much of the expansion in 2014 occurred part-way through the year) and the time it takes for the newly insured to find a provider and for providers to increase hiring in response.[iii]
We estimate that roughly 240 thousand health jobs have been added by expanded coverage between 2014 and 2016.[iv] Health jobs grew at an average rate of 2.5% in 2015 and 2016. As a rough estimate of what the growth rate would have been without coverage expansion, we use 1.7%, which is the average rate for the years 2010 through 2013. Using this rate, we estimate that of the 745 thousand health jobs added between 2014 and 2016, about 240 thousand were due to expanded coverage.[v] This is, of course, a rough estimate based upon the assumption that health jobs would have grown at 1.7% in 2015 and 2016 in the absence of expanded coverage and that the faster growth was due solely to expanded coverage.
To examine the hypothesis that the acceleration in health job growth in 2015 and 2016 was due to expanded coverage, we analyzed state-level data to see if states with higher rates of expanded coverage showed higher acceleration in health job growth.
Coverage and Job Health Growth: State-Level Data
Figure 2 displays the relationship between state-level coverage expansion and health job growth. The horizontal axis shows the change, from 2013 to 2015, in the percent of the state population covered by any form of health insurance. The vertical axis displays the change in the health job growth rate following coverage expansion. Specifically, it is the difference between health job growth during the expanded coverage period (June 2014 through December 2016) and the pre-expanded coverage period (June 2012 through June 2014). Forty states are included in the analysis due to lack of data for 10 states (listed in the footnote to Figure 2).
What we expected. We expected the change in health job growth rates to be greater for states that experience the largest increases in coverage. If expanded coverage accounts for all of the job growth change, we would expect states with very little expanded coverage to show very little change in health job growth rates.[vi]
What we saw. The data show the expected positive relationship between coverage expansion and change in health job growth. A weighted regression (using the square root of the number of health care sector jobs as weights) shows that this relationship is statistically significant (Figure 3). The regression intercept (0.2%) suggests that only 0.2 percentage points of job growth change would have occurred in the absence of expanded coverage. Thus the state level data are consistent with the hypothesis that expanded coverage accounted for most of the change in health job growth in 2015 and 2016.
Figure 2: Increase in Health Job Growth Rate Vs Increase in Percent Insured
Source: Altarum Center for Sustainable Health Spending. The percentage point increase in the insured population refers to 2013 to 2015 and is derived from American Community Survey data. The percentage point change in health jobs is the difference in job growth between June 2014 and December 2016 and June 2012 and June 2014 (annualized rates). Health jobs data are from the BLS Current Employment Statistics and are available for 40 states (the 10 missing states are AK, IA, KS, MS, NV, NH, NM, SC, SD and WV).
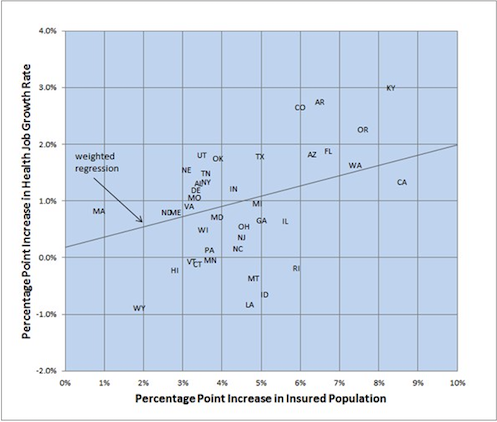
Figure 3: Weighted Regression Statistics
Source: Computed from data in Figure 2 using the square root of health jobs in 2015 as weights.
Implications for 2017 and Beyond
As projected by the CBO, the AHCA, if it were to become law, would reduce the number of people with health insurance by 14 million in 2018, through reductions in tax credits and Medicaid funding. This would largely reverse the previous gains in coverage (18 million[vii]) from 2013 through 2016, and therefore, based on our analysis, largely reverse the growth in health jobs that resulted from expanded coverage.
With AHCA tabled, but ACA repeal or modification not fully abandoned, the health sector will continue to operate under uncertainty. Early 2017 jobs data suggest that providers and health systems may have already begun to slow hiring, whether due to this uncertainty or a gradual return to the pace of growth seen prior to expanded coverage. During January and February, monthly health sector job growth averaged only 19 thousand, compared to the monthly average of 32 thousand for 2015 and 2016. Should monthly gains continue at this rate, the health job growth rates will drop below 2% by mid-year and stabilize near the 1.7% average growth seen in 2010 through 2013.[viii]
Notes:
[i] Health jobs refers to jobs in health care services such as hospitals, physician offices and clinics, nursing homes, home health, and dentist offices.
[ii] The drop in the rate of hiring in 2013 and 2014 was driven mainly by hospitals and a likely contributor was the Sequester which reduced Medicare payments to hospitals by 2% starting in the middle of 2013.
[iii] For evidence of such lags, see exhibit 2 in Donohue, et. al, showing how prescription drug use of new enrollees increases incrementally over many months rather than all at once.
[iv] This represents a 1.6% increase in jobs that we are attributing to the 18 million individuals gaining coverage between 2013 and 2016. It is roughly in line with previous research suggesting that, for every 10 million people who gain coverage, health care utilization and workforce requirements would increase by about 0.7%, with some added short term increases due to double payments for previously uncompensated care. One recent study estimated a loss of 912 thousand health jobs by 2019 under ACA repeal while another estimated roughly 400 thousand.
[v] The actual number of health jobs increased from 14.7 million in 2014 to 15.4 million in 2016.
[vi] State health job growth rates are also impacted by factors such as population growth and aging. Our analysis assumes that these factors did not change significantly during our study period.
[vii] Figure 1 shows coverage increasing by 5.7 percentage points which, applied to the 2016 US population of 324 million, gives coverage gains of about 18 million.
[viii] We report year-over-year growth. For monthly data, this means comparing health jobs in the current month with health jobs in the same month of the preceding year.