I’ve been advised that I should state up front that what I’m about to illustrate is not what Rep. Ryan has proposed. It’s different.
Table 4.1 of the Medicare competitive bidding book by Coulam, Feldman, and Dowd has the key numbers to illustrate the concept. It includes data relevant to and simulated results for competitive bidding as if it existed in 2005. I made two of the three charts below from the table entries.
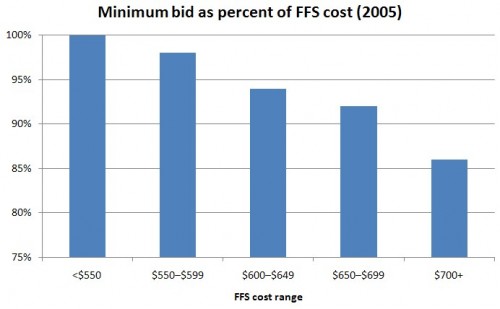
The first chart, immediately below, shows actual 2005 Medicare Advantage (MA) bids (for provision of the standard Medicare benefit) as a percent of FFS (traditional) Medicare costs. What is plotted is the minimum bid-to-FFS cost ratio by FFS cost range. That is, per beneficiary FFS cost is computed in each county and then binned into ranges (shown on the horizontal axis). In all ranges of FFS cost, the minimum MA bid is no greater than FFS cost and is typically lower.
Pause here to recall that the whole point of competitive bidding is to set the Medicare voucher (a.k.a. subsidy, premium support, defined contribution) level at the minimum bid. That means MA plans and traditional Medicare would only be paid (subsidized) at the minimum bid level, as opposed to the much higher subsidy levels that exist today (more on that below). Beneficiaries would pay the rest. That’s how competitive bidding saves money. But, at the same time, it permits access to at least one plan with no additional premium above the standard Part B premium. That is, affordable access to the standard Medicare benefit is retained. (There would be low-income subsidies as well.)
Pause some more to ask, why the minimum MA bid is usually lower than FFS costs? Keep in mind the figure above was made from actual bid data. Bids reveal how much plans expect it will cost to provide the standard Medicare benefit. So, this is the truth speaking. Nothing is simulated yet. MA bids could be lower due to any or all of: favorable risk selection, selective contracting, care management, fraud control, and any other source of efficiency I haven’t specifically mentioned. I cannot say precisely to what extent each of these contributes to the lower bids. Note also that just because the minimum MA bid is usually below FFS costs, the average or typical bid may not be. By the nature of competitive bidding, we are cherry picking the cheapest plan. But that’s how the approach works. There’s nothing wrong with that.
Now, before anyone gets all bent out of shape about the fact that MA bids might be low largely due to favorable risk selection, let’s keep things in perspective. Even though plan bids may be below FFS costs, under current law we pay MA plans far above FFS costs. That is, though plans may enroll cheaper than average beneficiaries, we’re paying them now as if they are enrolling the sickest beneficiaries in Medicare. Shouldn’t we pay them less? Do we need to wait for perfect risk adjustment to do that?
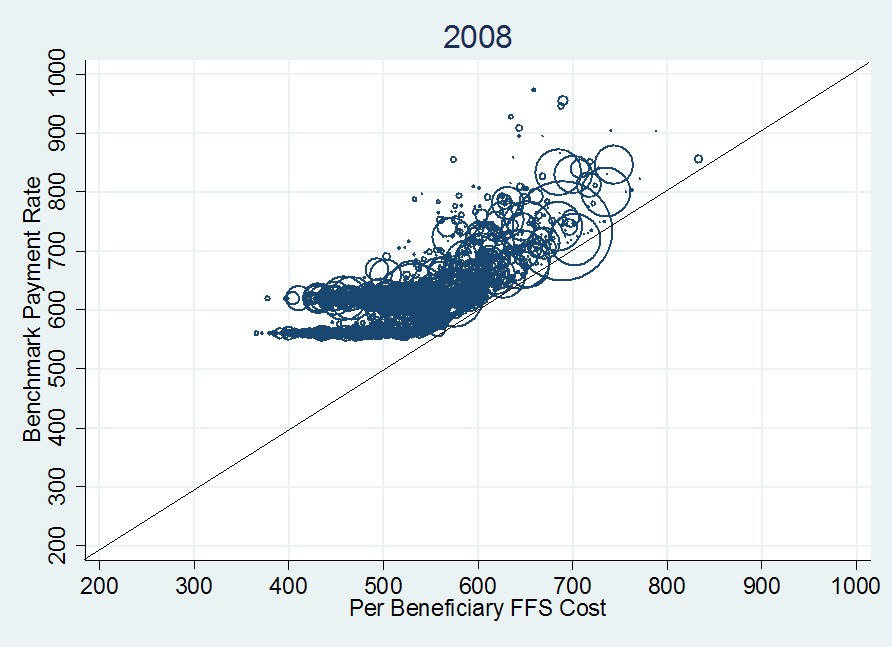
The proof that we overpay MA plans is in tons of papers and reports, and also in the following figure, from 2008 MA payment data (strictly speaking, what’s shown are “benchmarks,” but those are pretty close to payments).
About this figure, I once wrote,
Each datum is a circle that represents a single U.S. county, of which there are about 3,100. The area of each circle is proportional to the total county MA enrollment. The 45-degree line indicates what the payment rate would be if it were set to FFS cost. […]
The first thing to notice about the 2008 plot is that every county benchmark exceeds FFS cost (the centers of all circles are above the 45-degree line). Moreover, many of them exceed the FFS cost by a lot. This is a visual representation of the additional cost to Medicare of MA enrollees.
Additional details about the features of this graph are in the prior post from which I quoted. So, how much do you think we should pay MA plans, what we pay now, which is still well above FFS cost, or the minimum necessary to guarantee access where plans are offered? Those who are uncomfortable with competitive bidding should think carefully about how much they are willing to pay to retain the current system, which pays private plans far more than their costs.
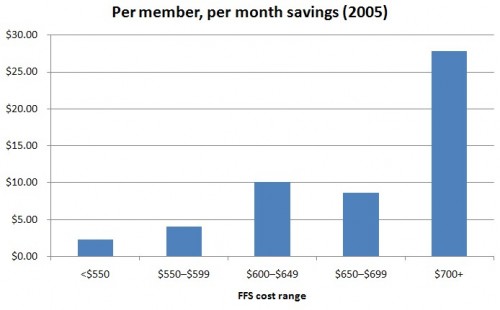
Suppose we had adopted competitive bidding in 2005. What would the savings look like? The figures for such a simulation are in Table 4.1 of the Medicare competitive bidding book by Coulam, Feldman, and Dowd. I’ve put some of them into the following chart. The horizontal access are the same FFS cost ranges as in the first chart of this post. The bars are the per member, per month savings if plan payments are set to the minimum bid. These figures are enrollment weighted so they bounce around according to bid levels and the size of the plans (and FFS) in the various regions associated with the FFS cost ranges.
Relative to how we actually paid plans in 2005, the competitive bidding approach would have saved money in every FFS cost range depicted in the figure. If you add them up weighting by enrollees, the total savings would have been about $50 billion dollars, or about 8% of the entire Medicare budget. Now, this is only an estimate, based on some assumptions, not all of which would hold in a real competitive bidding environment. So, it is illustrative. Maybe the savings estimate is too high. On the other hand, the dynamic effect of competitive bidding — how the incentives it creates change plan and beneficiary behavior over time — could lead to greater savings than a one-year snapshot can capture. Since we’ve never experimented with a fair, head-to-head competitive bidding approach between MA and FFS Medicare like this we have to make our best estimate using less than ideal data.
I think the best way to view all of this is to admit that private plans and traditional, FFS Medicare are likely to both remain part of the program. We’re not going to get 100% privatization or 100% government. The recent enrollment split has been closer to 22% MA, 78% FFS or so. If that’s the political equilibrium — and I think it is — how should we pay plans? Why pay more than necessary? Or, if you think we do need to pay more than suggested above, what’s the rationale for that?
Lastly, the plan payments under the ACA’s exchanges would be and in Medicare Part D are based on competitive bidding schemes. If you think one or the other is a sound approach, why should we not apply the same type of system to Medicare plans that cover non-drug benefits? Isn’t it time to expand our notion of the possible?
UPDATE: Some small edits for clarity.


