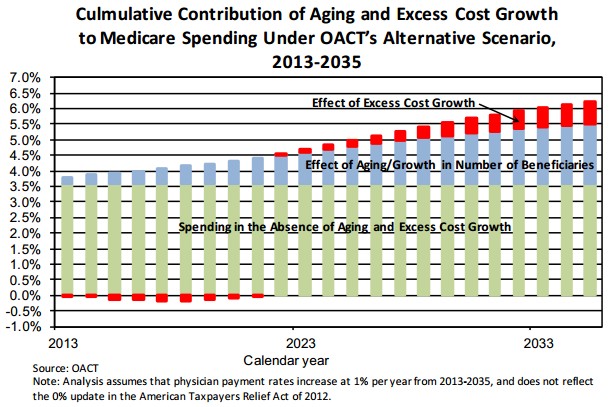
The vertical axis is percent of GDP. “Excess cost growth” means in excess of the rate of GDP growth. The chart is from a new ASPE report by Richard Kronick and Rosa Po. Description of what is meant by “OACT’s alternative scenario” is found in a follow-up post. Is an excess cost growth totaling three-quarters of a percentage point of GDP over two decades a lot?
UPDATE: Deleted incorrect description of assumptions, which are now documented in a follow-up post.