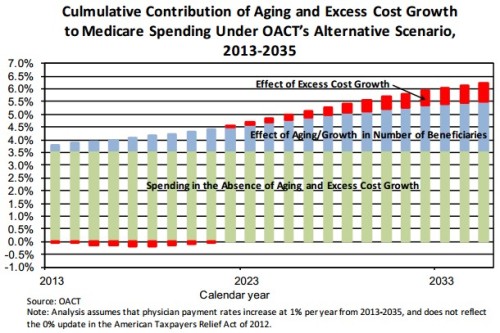
Richard Kronick, one of the authors of the ASPE policy brief from which I drew my chart of the day, wrote me about my post. At issue is what assumptions drive projected excess cost growth in Medicare.
As stated in the chart and in the policy brief, the projection is based on the assumptions of the OACT’s “alternative scenario.” I looked up what that was and found it here, beginning on page 12 (PDF). I summarized what I found there as follows.
Note that in addition to assuming a perpetual doc fix, it also assumes “a gradual phase-down of the productivity adjustments [] and the elimination of the IPAB requirements.”
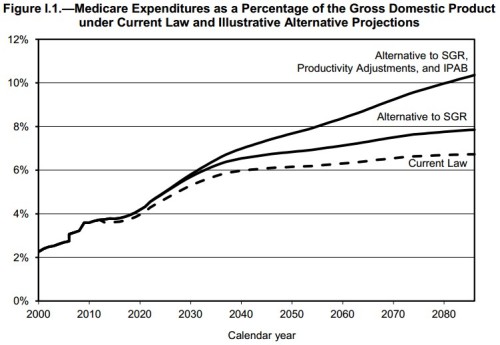
By email Kronick wrote me that that is not right. There are, confusingly, two “alternative scenarios” as depicted on page 4 of the Trustees Report (PDF).
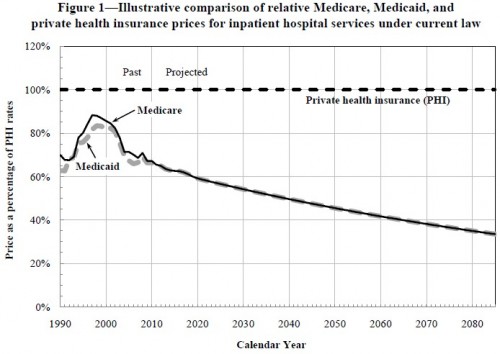
As you can see from the figure, one alternative scenario assumes a permanent fix to the SGR (a doc fix) and another that assumes that plus a moderation of the productivity adjustments and an impotent IPAB. As noted above, I thought the ASPE policy brief was based on the latter alternative, but Kronick explained that it is based on the former. Crucially, it presumes that the productivity adjustments will go into effect in full. That seems like a pretty strong assumption because it could imply this:
Is it plausible that Medicare payments to hospitals can dip down to half those of private health insurers by 2035 without creating enormous problems for hospitals and the patients they serve? I’m among the skeptical. But this doesn’t necessarily mean that Medicare prices can’t be cut as planned. It just means that hospital costs have to fall enough so that private prices can come down (relative to trend) as well. That is, the figure just above looks nuts because of the divergence between private and public prices. If all prices trend similarly, that divergence won’t occur, what’s shown in the chart just above won’t occur, and the excess cost growth projection in the first chart above will be reasonable to expect.
Of course this is all speculative and hopeful. There are good reasons to think private prices won’t come down along with Medicare’s. Among them is the growing market power of providers, as encouraged by the ACA itself.
Whether or not this all shakes out as projected, it’s still clear we will need more revenue to cover the demographically driven costs of Medicare plus some more for excess cost growth. One hopes that latter is small, but it’s not likely to be zero. And it could be uncomfortably large.


