
The CBO published a new chart that illustrates how year-by-year projections of the ACA’s budget impact have deviated in the last four years. In two words: not much.
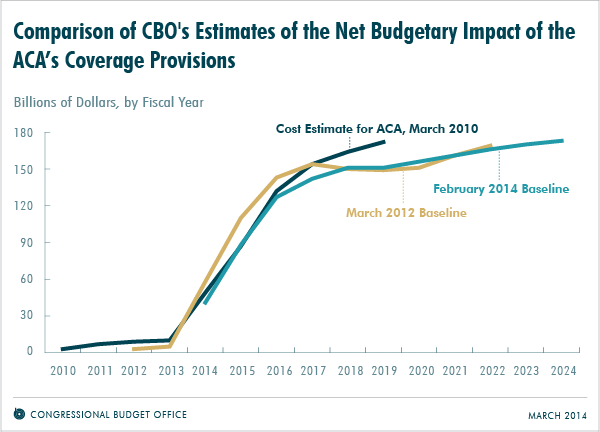
[In March 2010], CBO and JCT projected that the provisions of the ACA related to health insurance coverage would cost the federal government $759 billion during fiscal years 2014 through 2019 (which was the last year in the 10-year budget window being used at that time). The newest projections indicate that those provisions will cost $701 billion over that same period. Intervening projections (March 2012 is shown in the figure below) of the cost of the ACA’s coverage provisions for those years have all been close to those figures on a year-by-year basis.
The chart is only for coverage provisions, meaning it doesn’t capture other changes in spending and revenue expected to offset these costs (and then some).
So, what’s changed here?
- Premiums came in substantially below early estimates, inducing the CBO to reduce the estimated cost of premiums by 15 percent. The agency only revised the premiums for 2014, stating “limited information […] did not provide a sound basis for changing estimates of enrollment or premiums for future years.” If those low premiums stick, the budgetary impact could be significant.
- Risk corridor projections, initially scored as budget neutral, were revised. CBO now expects the program to net the federal government $8 billion through the program’s duration, if the risk corridor program in Medicare Part D is appropriately instructive.
- Delaying the employer mandate by one year means the feds are collecting less revenue through the employer penalty and paying more out in subsidies than anticipated. CBO previously estimated this to increase spending by $12 billion over ten years.
- The fact that 23 states are still against the Medicaid expansion means, among other things, that the federal government will be spending less than anticipated on Medicaid. (Of course, it also means that millions of low-income residents will be left without access to affordable health care.)
- The administrative “like it/keep” fix it should add to both sides of the ledger. On the one hand, individuals who choose to maintain their current plan might have otherwise claimed subsidies, which means the government is spending less. That said, the fix also means that individuals who had noncompliant individual market insurance are exempt from the mandate/penalty, meaning that the feds may collect less revenue that projected. In theory, the fix could also lead to some level of adverse selection (and higher premiums) if it causes the exchanges to skew sicker.
One logical corollary of lower spending is harder to get excited about: CBO expects fewer people to be covered in the early years of the ACA. In addition to reductions from states not expanding Medicaid, the agency reduced enrollment projections as a consequence of the glitchy rollout. Netting the impact, CBO estimates that 1 million more people will be uninsured than they projected in May 2013.
Despite the botched rollout and administrative tweaks, the ACA’s bottom line is largely unchanged: it’s still expected to reduce the deficit—and costs are lower than we initially thought.
Adrianna (@onceuponA)
