
You’ve all sent me lots of emails on “blockbuster” results from a new study which says that Americans have just given up when it comes to exercise. It says that the percent of women who do NO exercise in their free time went from 19% in 1988 to 52% in 2010. For men, it went from 11% in 1988 to 43% in 2010.
And, yes, there are lots of articles that now say that obesity is due to a lack of exercise, not diet.
Let’s start with the claim about exercise vs. diet. There’s nothing in this study which says that’s true. There’s no study I know of that shows that exercise is more important than diet with it comes to weight loss. That’s just not the case.
But let’s talk about the findings. The abstract:
Background: Obesity and abdominal obesity are independently associated with morbidity and mortality. Physical activity attenuates these risks. We examined trends in obesity, abdominal obesity, physical activity, and caloric intake in U.S. adults from 1988 to 2010.
Methods: Univariate and multivariate analyses were performed using National Health and Nutrition Examination Survey (NHANES) data.
Now you’d think from these results, that the study looked at trends over time. For obesity and other measures, it appears they did. But for “physical activity”, it appears that they have two data points. One is “1988-1994”, and the other is “2009-2010”.
That’s a bit odd. What happened in between? Because the first concern I’d have is how NHANES measured “physical inactivity” in the survey. Was it consistent? Did it change over that time? (I’m seriously asking. I don’t know. Any of you?)
The bigger concern, though, is that this study seems to assume a linear relationship between those two points. And that I dispute. It’s not like other data aren’t available.
Let’s start with data from 1988-2002, which includes 35 states and the District of Columbia. Here’s a chart I made from the data:
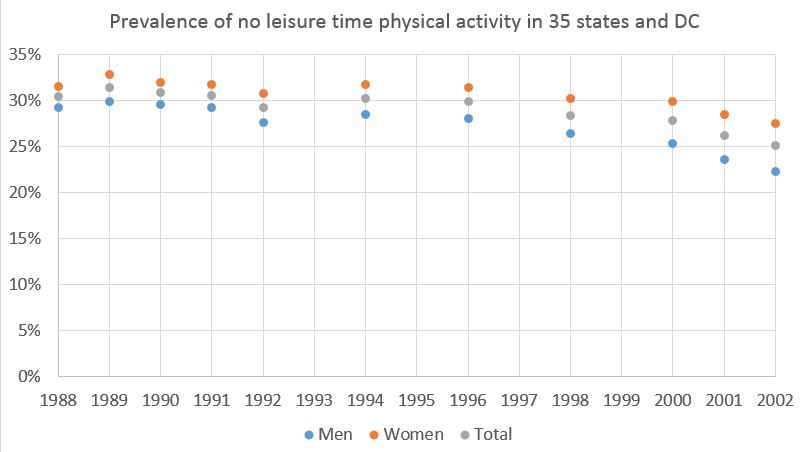
This chart starts from 1988, and includes the whole “1988-2004” period. The results don’t look nearly as awesome back then as they are reported in the new study, and the overall trend over time is looking better and better with respect to Americans engaging in some activity.
Then, there’s an MMWR report from 2005, describing trends in leisure time physical inactivity from 1994-2004. I made a chart from their data:
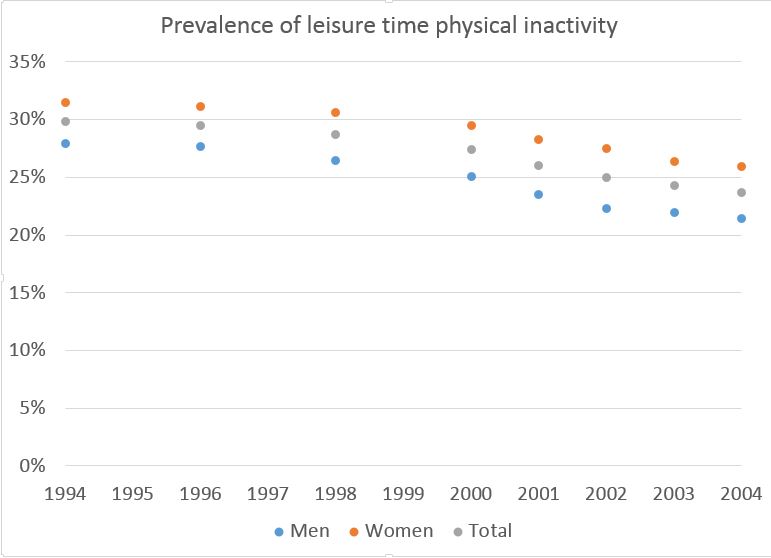
Two things to note here. In 1994, the percent of people who reported being “inactive” was about 30%. That’s way higher than the estimate seen in the “1988-1994” data point in the new study. The second is that over time, physical inactivity decreased. That’s a good thing!
I wish I could find more recent data, but it’s not readily available. There is, however, this report saying that in 2008, 25.4% of the US reported no leisure time physical activity. That’s nowhere near what this recent study reported in their “2009-2010” data point.
Now it’s possible that NHANES (which the more recent study used) and BRFSS (which the CDC data use) are different, leading to different point estimates. But the trend should be similar, and in the CDC data, it appears that inactivity has been going down, not up.
And with respect to NHANES, there’s also this (emphasis mine):
BACKGROUND: Three U.S. surveillance systems-National Health Interview Survey (NHIS), National Health and Nutrition Examination Survey (NHANES), and Behavioral Risk Factor Surveillance System (BRFSS)–estimate physical activity prevalence.
METHODS: Survey differences were examined qualitatively. Prevalence estimates by sex, age, and race/ethnicity were assessed for comparable survey periods. Trends were examined from NHIS 1998 to 2007, NHANES 1999 to 2006, and BRFSS 2001 to 2007.
RESULTS: Age-adjusted prevalence estimates appeared most similar for NHIS 2005 (physically active: 30.2%, inactive: 40.7%) and NHANES 2005 to 2006 (physically active: 33.5%, inactive: 32.4%). In BRFSS 2005, prevalence of being physically active was 48.3% and inactive was 13.9%. Across all systems, men were more likely to be active than women; non-Hispanic whites were most likely to be active; as age increased, overall prevalence of being active decreased. Prevalence of being active exhibited a significant increasing trend only in BRFSS 2001 to 2007 (P < .001), while prevalence of being inactive decreased significantly in NHANES 1999 to 2006 (P < .001) and BRFSS 2001 to 2007 (P < .001).
This is the same data source (NHANES) showing that physical inactivity had a point estimate of 32.4% in 2006, and had been decreasing from 1999 to 2006.
So what gives? Did something crazy happen in the last few years to make this new study find a bizarrely high new inactivity level that reversed this long trend? Did Americans all of a sudden just quit being active en masse after years of doing better? Or did the measurement metric change in such a way as to make the reported levels jump through the roof? I’m seriously asking! Because it seems hard to account for how this new study’s two data points fit into the many years of data we have in between. If the data points are outliers, there are a lot of people making a lot of claims that may be totally wrong.
