Last week Thom Walsh explained some differences between supplier-induced demand and supply-induced demand (aka, supply sensitive care), terms often confused with one another. In this post I cover what I think is the crucial distinction.
The first few pages of Victor Fuchs’ The Supply of Surgeons and the Demand for Operations (The Journal of Human Resources, 1978) includes a nice, graphical treatment of the concept of supplier-induced demand (SID). It’s ungated, so there’s no barrier to you reading it for yourself. Below I reproduce the main points anyway. Then I’ll contrast SID with supply-sensitive care.
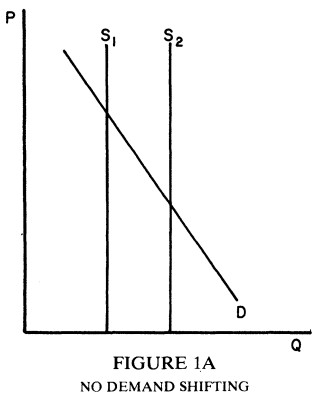
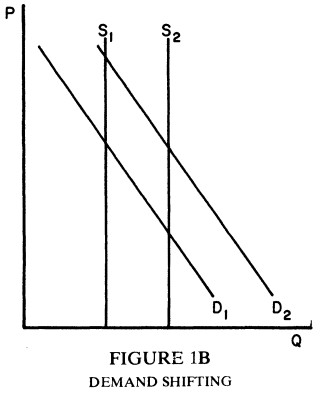
SID is a deviation from standard economic theory. Normally, we think of supply and demand as independently determined. However, SID theory is that physicians (the suppliers) can induce a shift in demand by patients. (Fuchs calls it the “demand-shifting hypothesis.”) The distinction between standard and SID theory is easily seen in the following two charts from the paper, labeled Figure 1A and Figure 1B.
Figure 1A illustrates the standard theory: a shift in supply (from S1 to S2 or vice versa) has no effect on the demand schedule (D). The market equilibrium changes, as indicated by the different points of intersection between D and S1 or S2, but in both cases it’s the same demand curve that’s relevant. Consumers’ quantity-price demand relationship has not changed. As this figure illustrates, all care is supply sensitive to some extent (greater supply leads to greater quantity, Q). The degree to which it is depends on the slope of the demand curve (or the elasticity of demand). Some services are more supply sensitive than others for this reason.
Figure 1B illustrates SID theory. If the supply schedule shifts from S1 to S2, suppliers induce a corresponding shift in the demand curve from D1 to D2. Somehow suppliers have caused consumers to demand a larger quantity at every price. (Though Fuchs doesn’t mention it, another way physicians might induce demand is to change the slope of the demand curve.)
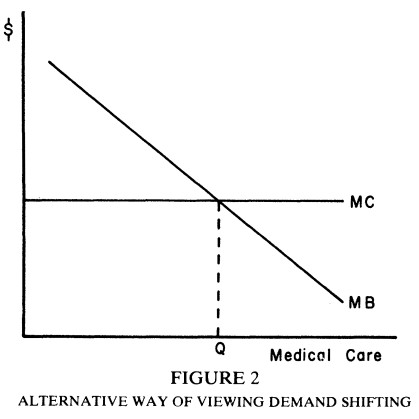
Figure 2, below, provides another way to consider SID. MC is the marginal cost of care, assumed constant for all quantities. MB is the schedule of marginal benefit. As quantity increases, marginal benefit decreases. The next unit of care is not as valuable as the previous one.
One question is, who chooses the actual quantity of care delivered, Q? Fuchs points out that even if the provider chooses Q, that is not itself evidence of SID. The physician, acting as an agent on behalf of the patient, may select the same Q that a fully informed patient would himself. The more interesting case is when the Q selected by the physician is not what a fully informed patient would choose.
If the physician/population is relatively high in an area (for reasons unrelated to demand), they may push quantity to the right of Q in order to keep prices and incomes from falling drastically [as in the shift from D1 to D2 in Figure 1B]. If there are relatively few physicians in an area, and if they cannot or do not raise price to an equilibrium level, they may push quantity to the left of Q in order to avoid excessive work. This latter situation, sometimes characterized as “excess demand,” has been offered as an explanation for the observed correlation between supply and utilization. It would be described in Figure 1A by a price that is below the intersection of S1 and demand. A shift of supply to the right results in higher utilization because it takes care of some of the excess demand.
Note that the presence of demand-shifting should not be equated with “unnecessary care.” If “necessary care” is defined as Q in Figure 2, demand-shifting to the left implies that some patients are not getting the care they should, and does not imply that any patients are getting unnecessary care. Moreover, necessary care may be defined differently than the quantity that maximizes the patient’s utility (i.e., Q). If, for instance, it is defined as the quantity that maximizes the patient’s health regardless of cost, the optimum would clearly be to the right of Q, and such demand-shifting would not necessarily imply “unnecessary care.”
The severing of SID from “necessary” and “unnecessary” care is important. Though most of us could point to care that fits those descriptions (even if we disagree on which specific types of care do), SID need not correspond. It’s my hypothesis that sensitivity to the possibility of insulting physicians with an implication of provision of unnecessary care (or withholding necessary care) has led many authors to back away from clear language about SID. That’s a shame.
The term “supply-sensitive care” (SSC) has been suggested to me as a less pejorative alternative to SID. But I don’t think it’s synonymous. (I covered supply-sensitive care last week.) To see this, recall that SSC is care delivered at a volume that responds to availability of provider supply and in ways that cannot be explained by other factors like the health of the patient population. That’s consistent with Figure 1A, for which SID does not apply. SID is different. It’s a shift in demand induced by suppliers (Figure 1B). It’s not merely a shift in supply that leads to greater utilization.
Both SSC and SID might be associated with over- or under-provision of care, something that is implied by the geographic variations literature. However, that observation does not itself define what the “right” rate of care should be.
Why might SID occur? I’ll address that question tomorrow.


