It’s the clash of titans.
In January the Massachusetts the Group Insurance Commission (GIC) — the state agency that provides health insurance to nearly a half-million public employees, retirees, and their families — voted to cap provider payments at 160% of Medicare rates. Ignoring Medicare (~1M enrollees) and Medicaid (~1.6M enrollees), the GIC is the largest insurance group in the state. According to reporting from The Boston Globe, the cap would be binding on a small number of concentrated providers, including Partners HealthCare, one of the largest hospital systems in the state.
David Anderson summed the development up perfectly.
The core of the fight is a big payer (the state employee plan) wants to use its market power to get a better rate from a set of powerfully concentrated providers who have used their market power to get very high rates historically.
Anderson also pointed to a relevant, recent study that illustrates how a specific payer’s and provider’s market power jointly affect prices. In Health Affairs, Eric Roberts, Michael Chernew, and J. Michael McWilliams studied the phenomenon directly, which has rarely been done. Most prior work aggregate market power or prices across providers or payers in markets.
Their source of price data was FAIR Health, which includes claims data from about 60 insurers across all states and D.C. In a county-level analysis, the authors crunched 2014 data for just ten of those insurers that offered PPO and POS plans and that did not have solely capitated contracts. These ten insurers represent 15% of commercial market enrollment. They then looked at prices paid by these insurers to providers in independent office settings for evaluation and management CPT codes 99213, 99214, and 99215. These span moderate length visits to longer visits for more complex patients and collectively represent 21% of FAIR Health captured claims.
They computed insurer market share based on within-county enrollment. They computed a provider group’s market share as the county proportion of provider taxpayer identification numbers (TIN) associated with that group’s National Provider Identifier (NPI) — basically the size of group in terms of number of physicians.
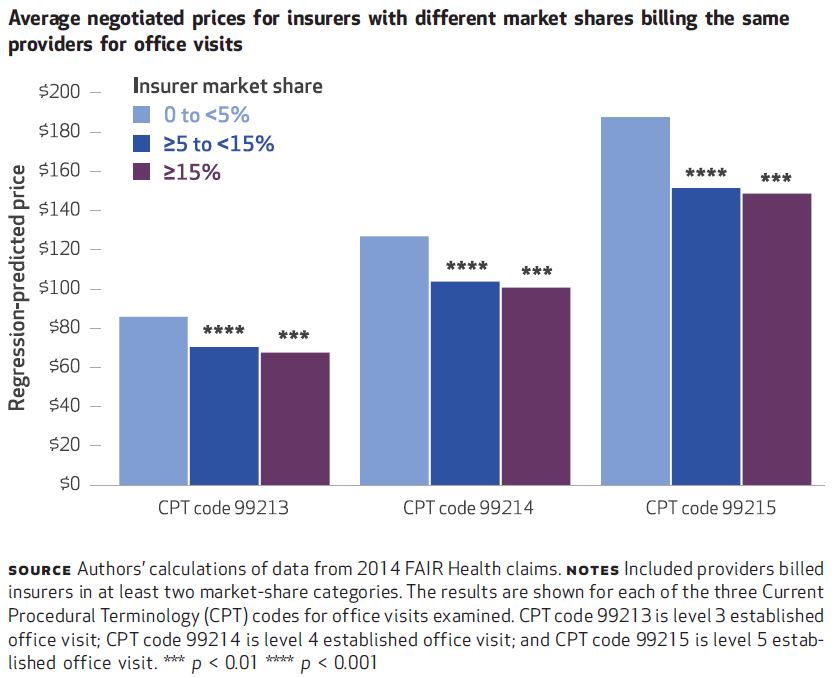
Some of the findings are illustrated in the charts below and are largely consistent with expectations. For all three CPT codes, insurers with greater market shares tend to pay lower prices. That’s shown just below. The biggest price drop occurs when moving from <5% to 5-15% market share. Greater market share than that is associated with still lower prices, but not by as much. For example, insurers with <5% market share pay an average of $86 for CPT code 99213; insurers with 5-15% market share pay 18% less and insurers with ≥15% just a few percent less than that. It’s roughly the same story for other CPT codes.
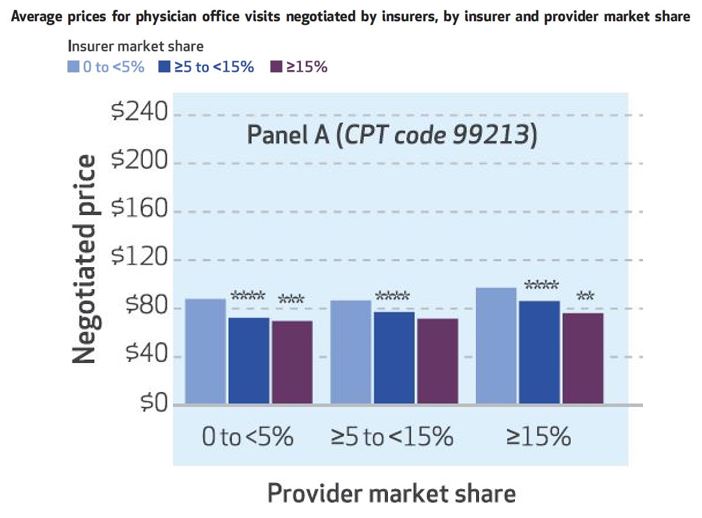
That tells the expected story of payer market power, but what about providers? The authors also look at that, and one of their sets of results is illustrated in the chart below, for CPT code 99213. Again, greater insurer market power is associated with lower prices — you can see that within each of the three sets of colored bars.
Each of those sets is for prices is for a different level of provider market share, 0 to 5%, ≥5 to 15%, and ≥15%. As one would expect, greater provider market share is associated with higher prices. Among providers with 0-5% market shares, the average CPT 99213 price is $88 for insurers with market shares of <5%, $72 for insurers with ≥5 to <15% market shares and $70 for insurers with market shares ≥15%. Among larger provider groups, with market shares ≥15%, price levels are higher: the average price for insurers with market shares of <5% is $97, for insurers with ≥5 to <15% market shares, it’s $86, and for insurers with market shares ≥15% percent it’s $76.
The results are similar for the other two CPT codes: higher prices are independently associated with greater provider market share and lower insurer market share.
From the research literature, we’ve long known that provider consolidation leads to higher prices. One of the arguments for insurer consolidation is to push prices downward. However, that doesn’t imply that the right policy approach to high health care prices is greater insurer market power, as there’s no guarantee that dominant insures will pass lower prices onto consumers. Minimum medical loss ratio regulations that would limit insurer relative profit margins don’t necessarily help because they could encourage a dominant insurer to keep price levels higher to extract higher absolute profits.
However, other approaches that push prices downward can help consumers as well. One example is reference pricing. Other approaches include price transparency, higher consumer cost sharing, and narrowing of networks. (Not all of these have been shown to consistently achieve their intended results.) These are not mutually exclusive approaches. The GIC, in addition to flexing its market power to push prices downward, has also offered narrow network plans that have saved enrollees substantially.
For lowering health care prices, there are a lot of tools in the toolbox. But history suggests we haven’t settled on ones that both work and that patients and other stakeholders are willing to tolerate for long. Continued experimentation and analysis is essential.