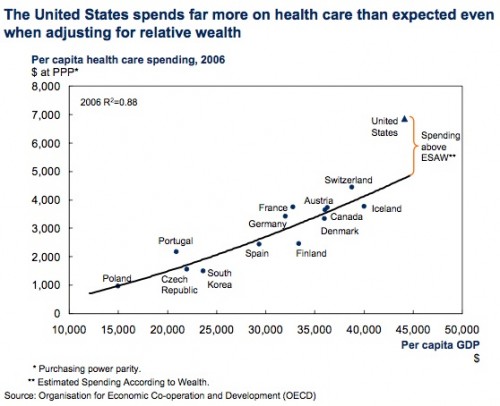
A number of you took umbrage to the McKinsey chart showing our spending above GDP. Here it is again:
First of all, some of you took exception to the fact that the R2 fit is 0.88. I grant you that in engineering, that’s probably not acceptable,but in areas like this, it’s indicative of significant correlation.
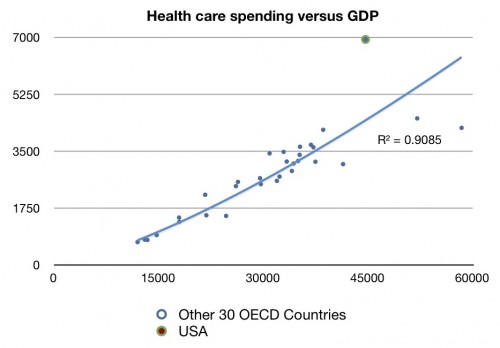
But some of you still cried foul. You didn’t see England. Or Japan. And you decided that people were trying to hide something from you. In the interest of assuring you that’s not the case, I went over to the OECD and downloaded data for 2006 for the full set of OECD nations. There are 31 of them. When you redo the analysis, this is what you get:
Not that different, huh?
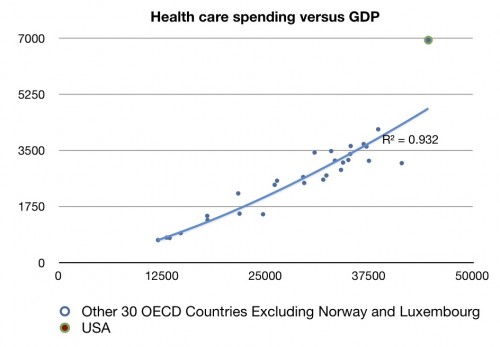
But McKinsey actually decided to drop Norway and Luxembourg (those two dots to the right) because those countries actually pull the line down. So let’s look at my redone chart with those two countries excluded:
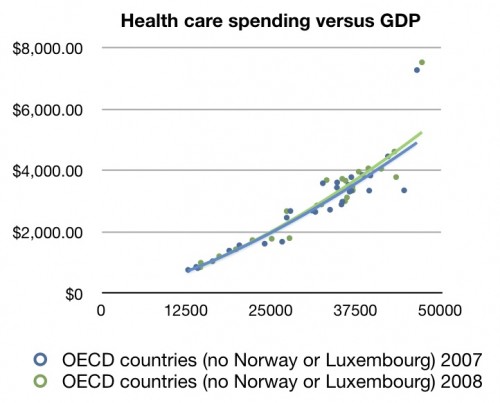
Still pretty much the same. Well, how about in 2007 or 2008? Have things changed?
It’s time to move past denial. We’re spending more than we should based on GDP. Much more.


