
I’m guilty of getting this wrong, and it is likely you are too:
If the p-value is <.05, then the probability of falsely rejecting the null hypothesis is <5%, right? […]
[According to Oakes (1986)] 86% of all professors and lecturers in the sample who were teaching statistics (!) answered [a similar] question erroneously. […] Gigerenzer, Kraus, and Vitouch replicated this result in 2000 in a German sample (here, the “statistics lecturer” category had 73% wrong). [Links not in the original, oddly. I added them. They could be wrong.]
Felix Schönbrodt explained how to answer the question:
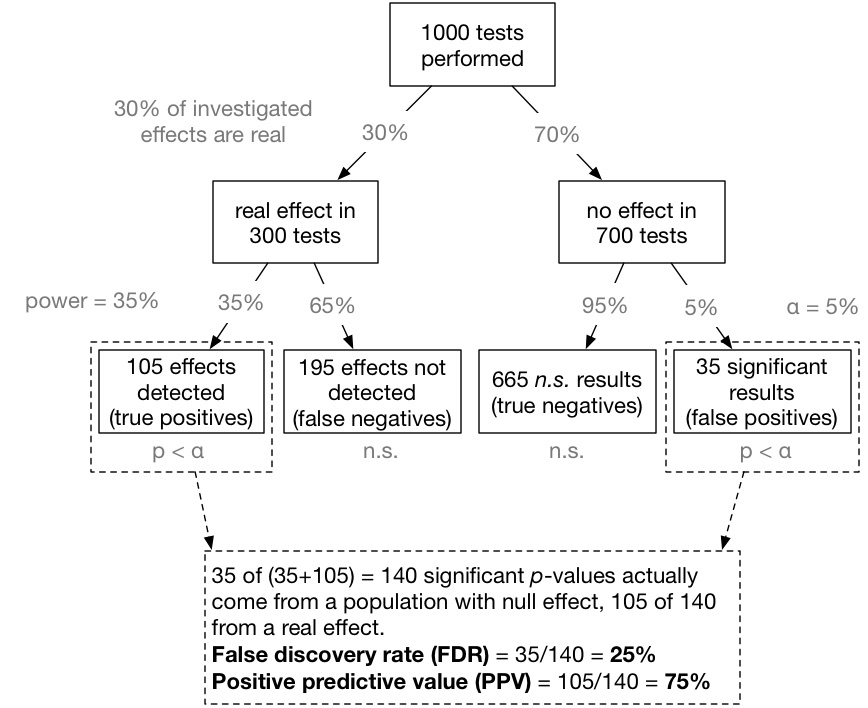
[W]e are interested in a conditional probability Prob(effect is real | p-value is significant). Inspired by Colquhoun (2014) one can visualize this conditional probability [for a specific example, though easily generalized] in the form of a tree-diagram (see below).
Now we can compute the false discovery rate (FDR): 35 of (35+105) = 140 significant p-values actually come from a null effect. That means, 35/140 = 25% of all significant p-values do not indicate a real effect! That is much more than the alleged 5% level (see also Lakens & Evers, 2014, and Ioannidis, 2005).
It’s obvious when you see it presented this way, and yet how often do you get this wrong? How much do you fixate on p < 0.05 as a very strong indication that rejecting the null is warranted (with at least 95% accuracy)? Be honest. It’s the only way to get smarter.
Caveat: To the extent one is able, it’s more typical in health research to design studies with 80% power. For the example above, 80% power translates into an FDR of 12.7%, not 25%. That’s still way above 5%, though. A lot of results taken to be “true” are actually not.
More here.
