
From a recent GAO Report. Fig. 2 looks like the US is underspending in prevention & public health, but since the denominator is total health spending, our middling result is not surprising at all:
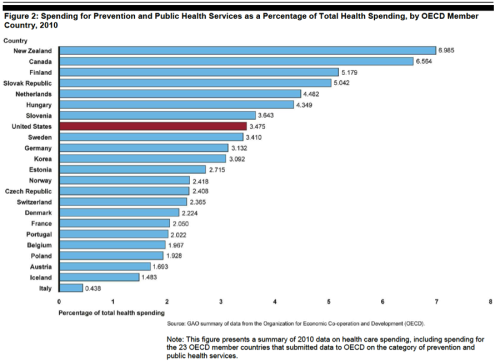
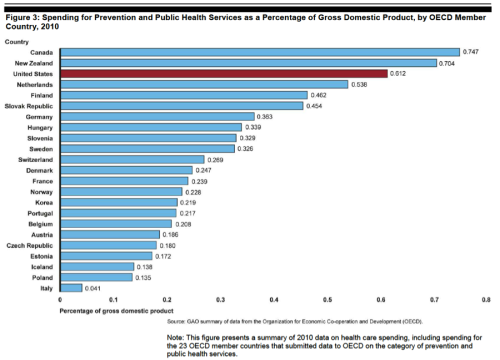
Fig. 3 tells a more surprising story:
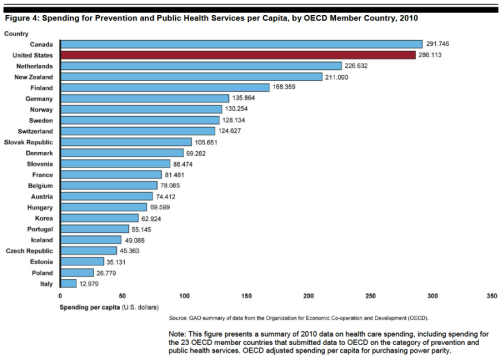
In Fig. 4, the US rates very highly per capita:
 Comments:
- It is surprising (to me) how highly the US ranks in per capita and % of GDP, despite our heavy reliance on private health insurance systems.
- All of this data is 2010, before the public health measures in PPACA had taken full effect.
- Is this political ammo for those who would cut the Prevention & Public Health Fund?
- Note the GAO’s comments on the limitations of the available data.
@koutterson
