Elsa Pearson is a Policy Analyst with Boston University’s School of Public Health. She tweets at @epearsonbusph. Research for this piece was supported by the Laura and John Arnold Foundation.
In general, the research literature on administrative costs, which I summarized in a prior TIE post, assesses three broad categories: billing and insurance-related costs, hospital administrative costs, and physician practice administrative costs. But, there has been little comparison of administrative costs across insurance types…until now.
As promised in that post, below is a review of the recent Gottlieb, Shapiro, and Dunn Health Affairs article that fills that gap in the literature. Gottlieb et al. focus on the differences in billing complexity across insurers. They use billing complexity as an indicator of the burden of total health care administrative costs within the US system.
Methods
The authors used 2013-2015 claims data from the IQVIA Real-World Data Adjudicated Claims. IQVIA collects claims data for all the payers with whom a sample of physicians contract or bill, allowing researchers to study differences across payers for the same provider. Gottlieb et al. principally analyzed a sample of 68,000 physicians in the 2015 IQVIA data, though also looked at trends in some measures from 2013-2015. They considered five insurance types: fee-for-service (FFS) Medicare, Medicare Advantage, FFS Medicaid, Medicaid Managed Care, and private.
The authors characterized billing complexity in multiple ways. One set of measures pertains to how much of each claim was never paid: amount challenged and share challenged. Amount challenged was defined as the difference between what was actually paid for services and the full negotiated price. Share challenged was defined as the fraction of the negotiated price that was never paid. The authors understand that challenged claims are not equivalent to total administrative costs but believe they are a strong indication of national cost trends.
In addition to these measures of challenged claims, they used another four complexity measures: time to payment, number of interactions between physician and payer, claim denial, and nonpayment.
The authors use these measures to characterize billing complexity in the following sense: challenging and denying claims, as well as additional interactions between physician and payer, requires work (and resources) from both parties. Effectively, billing complexity means that additional resources are ultimately required for each dollar paid.
Comparisons of measures across insurance types were conducted using physician-specific fixed effects and adjusting for the logarithm of the allowed charge, the number of claims, each patient’s Charlson Comorbidity Index score, and each patient’s age. This limited the impact of differing patient populations.
Results
The analysis included 37.2 million office visits, totaling 44.5 million insurance claims. FFS Medicare and private insurance each accounted for almost 40% of the claim data and included more lengthy claims due to more complex clinic visits.
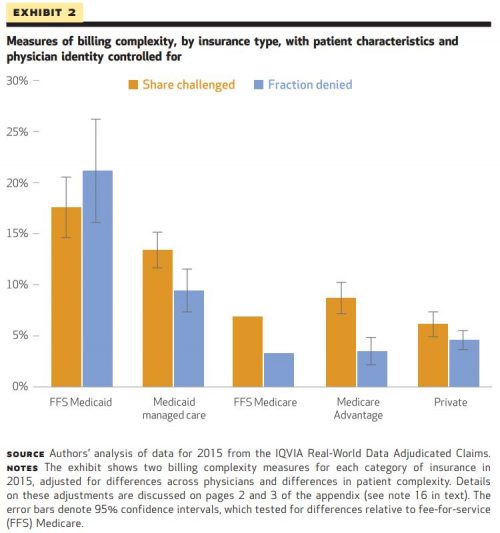
Overall, the authors found Medicaid, both FFS and Managed Care, to be the most complex insurer across all measures. Both types of Medicaid had the highest shares challenged (21% and 13%, respectively) as well as the longest times to payment. Medicaid claims were also denied three times as much as Medicare claims. (Of note, given lower overall potential payments, the monetary value of Medicaid shares challenged was comparable to other insurance types.)
The authors found billing complexity to be notable regardless of insurance type (for example, private insurers still had a share challenged of 6%) though the variation between insurers was substantial. Exhibit 2 shows this variation.
Finally, Gottlieb et al. extrapolated national estimates of contested claims. They calculated that the US health care sector handles up to $54 billion in challenged claims a year (though this estimate may be on the high end).
Limitations
As with any study, there are a few limitations. The authors note that the data are limited to only the physicians who participated in IQVIA’s collection process. Further still, the data do not adequately capture the breadth of insurance administration. For example, the data do not contain costs associated with prior authorizations, actuarial services, or marketing.
Impact
Since billing complexity varies across payers, reducing billing complexity is possible. (In other words, if FFS Medicare can have lower billing complexity than FFS Medicaid, perhaps there is room for improvement in FFS Medicaid billing practices.)
Reducing the administrative headache and wasted financial resources associated with billing practices may cause some providers to be more willing to accept patients with public insurance. Providers could also reclaim time and resources spent on administrative activities for patient care, increasing productivity.
The authors suggest a better understanding of administrative costs could also impact health policy, particularly antitrust policy and merger evaluation. Insurers and providers alike could weigh billing complexity when considering payment contracts, pursuing contracts based on administrative burden. Because of this, governing leadership could start to consider these types of nonmonetary aspects of insurer/provider relationships when assessing proposed mergers.
Gottlieb, Shapiro, and Dunn offer a fresh perspective on US health care administrative costs through their analysis of billing complexity. There seems to be some promise that billing complexity—and its associated costs—could be reduced across payers. In a health care system wrought with expense, it’s encouraging to see room for even small improvements.


