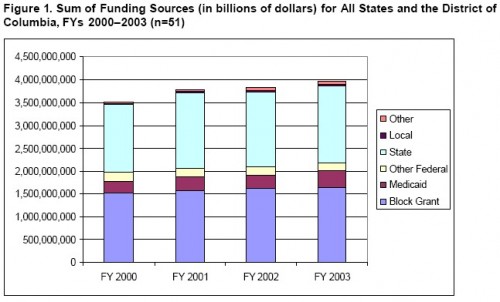
A large proportion of spending by states on substance use treatment and prevention is financed by federal block grants. That seems clear in the following figure, taken from the Office of National Drug Control Policy’s 2006 Inventory of State Substance Abuse Prevention and Treatment Activities and Expenditures. (I would really like to see more recent figures. I haven’t found any.)
One problem though. I don’t believe these figures. They’re not consistent with those of a recent Health Affairs paper or an HHS report. I think I know why. Let’s get into it.
In the figure, block grant funding is roughly equal to funding from state sources, each representing a little over 40% of total funding. However, as the ONDCP report says, this masks a lot of state variation.
For example, in FY 2003, 19 States reported that most (50 percent or more) of their total expenditures derived from the SAPT [Substance Abuse Prevention and Treatment] Block Grant, and 13 States reported that most (50 percent or more) derived from State funds:
States indicating that the majority of their expenditures came from Block Grant funds included Wisconsin (for which Block Grant funds accounted for 87 percent of total expenditures), Texas (86 percent), Alabama (77 percent), and Mississippi (75 percent). States using the smallest proportions of Block Grant funds, when compared with other States, included Wyoming and Alaska (at 13 percent each) and the District of Columbia (18 percent).
States indicating that the majority of their expenditures derived from State funds included New York, the District of Columbia, and Alaska (for which State funds accounted for 69 percent of total expenditures), and Connecticut (65 percent). States spending the smallest proportions of State funds, when compared with other States, included Texas (12 percent), Wisconsin (13 percent), and Alabama (15 percent).
One-half of the States reported spending Medicaid funds in their Block Grant application, and half did not. For those that did not report Medicaid expenditures, it is possible that their Medicaid funds flowed through a different State agency, other than the SSA [single state agency–the one that receives block grants]. For the 25 States reporting Medicaid expenditures along with their Block Grant and other funds, the States spending the highest proportions of Medicaid funds, when compared with other States, included Vermont (for which Medicaid accounted for 41 percent of total expenditures), Oregon (37 percent), Arizona (36 percent), and Kansas (32 percent). Those reporting the smallest proportions included Oklahoma (less than 1 percent) and Alaska, Colorado, and Maryland (at 1 percent each).
The fact that up to half the states may not be reporting their entire spending because Medicaid funds flow through a different agency than the one that handles block grants is a really big problem in terms of understanding the flow of funds. It potentially invalidates much of what is presented above. It probably explains why the figures above don’t match others that are based on more thorough data analysis.


