
In the current JAMA, David Ludwig reports that
Since the end of the Civil War until the late 20th century, lifespan increased rapidly in the United States, a tremendous public health triumph brought about by a more dependable food supply, improved sanitation, and advances in medical care… [But] With the start of the obesity epidemic in the late 1970s, this trend began to slow, leading some to predict that life expectancy would decline in the United States by the mid-21st century.
This would be a shocking change in the historical trend of steadily improving population health and Ludwig thinks it’s happening. In this post, I will explain how children and their developmental trajectories play an important role in this story.
Ludwig is commenting on CDC data that support the prediction by Olshansky and his colleagues that because of obesity,
the steady rise in life expectancy during the past two centuries may soon come to an end.
The data are just preliminary, but Ludwig argues that they show that
Age-adjusted death rates for the first 9 months of 2015 increased significantly compared with the same period in 2014, most notably involving causes of death related to obesity.
The CDC data are here and I have graphed them below.
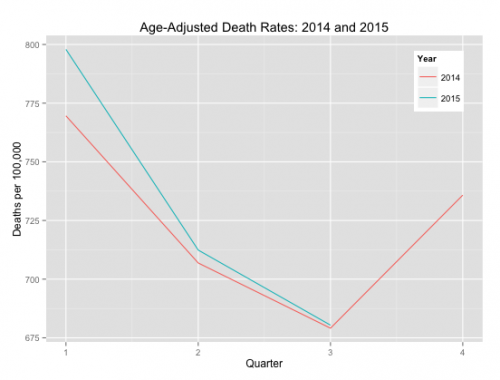
The red line presents age-adjusted death rates for each quarter of 2014 and the blue line presents the rates for the first three quarters of 2015.* The magnitude of the difference is not overwhelming and the difference is not significant for the 3rd quarter. But the magnitude of the increase is not the issue. The surprise is the change in sign in the year to year differences in mortality.
Many factors other than obesity are likely contributing to this change. For example, the CDC data show increases in suicide and drug overdoses, along with increases in deaths caused by disorders more plausibly associated with obesity. However, mortality appears to be increasing for all causes of death associated with obesity (except cancer), so it is reasonable to view increasing obesity as one cause of this change.
Ludwig makes an important point that
This downward trend in longevity will almost certainly accelerate as the current generation of children—with higher body weights from earlier in life than ever before—reaches adulthood. Modern medical care may prevent premature death among adults who develop obesity at age 45 years, diabetes at 55 years, and heart disease at 65 years, but the public health implications are likely vastly greater if this sequence of events were initiated in childhood.
There’s been recent good news that the rates of obesity among children appear to have stabilized. So why does Ludwig think that the downward trend in longevity will accelerate?
Here’s the way to think about this. We each have a trajectory of body weight across our lifespans. Let’s use the body mass index (BMI) as a measure, despite it’s faults. The data below show the average lifespan BMI trajectories of a longitudinal cohort of Americans born in about 1930 (Sutin et al., 2011).**
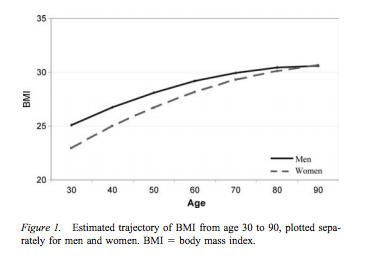
Over historical time, the average BMI trajectories for US cohorts have been rising. This means that many Americans born in later cohorts have been and likely will be obese for much of their lives. They will therefore be at increased risk for a host of chronic illnesses. Let’s hope that the recent stabilization in childhood obesity means that the rise in lifespan BMI trajectory will also stop. But even if it does, for a considerable time the average American will likely get more obese, as earlier cohorts with lower BMI trajectories die off and are replaced by later cohorts with higher trajectories.
Reducing obesity in the population means lowering the BMI trajectories: lowering the curves at the intercepts by reducing the number of obese children and, if we can, flattening the BMI trajectories in adulthood. This is one reason why health care for children matters, even though children are the healthiest members of the population. Behaviour patterns and metabolic set points established in childhood have consequences for the rest of our lives.
*The crude mortality rates — that is, rates that are not adjusted for age — show greater increase in mortality in from 2014 to 2015. You may object that my graph exaggerates the apparent change from 2014 to 2015 by not including zero on the vertical axis. This is a fair point, but consider that deaths / 100,000 = 0 implies an immortal population. That’s not a meaningful anchor point for epidemiological discussion.
**This is a 50-year longitudinal study. Longitudinal research is difficult and uncelebrated, but it is exceedingly important.
