We at the TheIncidentalEconomist.com go to work each day inspired by the Nobel Laureate Ronald Coase, who said:
If you torture the data enough, nature will always confess.
So far, however, we haven’t used our awesome analytic powers to interrogate data about the outcomes of Tuesday’s election. As part of my civic duty, I offer this projection of a key outcome of Tuesday’s election: whether I will survive it.
I’m hoping to spend Tuesday night in an Ottawa bar watching the election with American expatriates and Canadian political junkies. Most likely I will leave in an Uber, but there’s also a chance I’ll be transported by paramedics. Let’s work through the numbers.
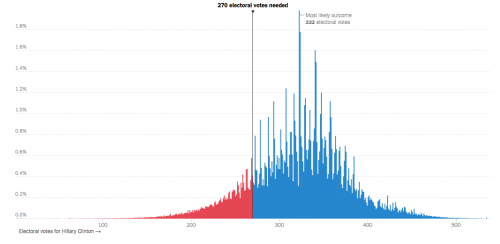
We’ll begin with the key political outcomes of the election: who wins the presidency and who wins the Senate. Here is The Upshot’s projected probability distribution (from a couple of days back) of the number of electoral votes Clinton will receive.

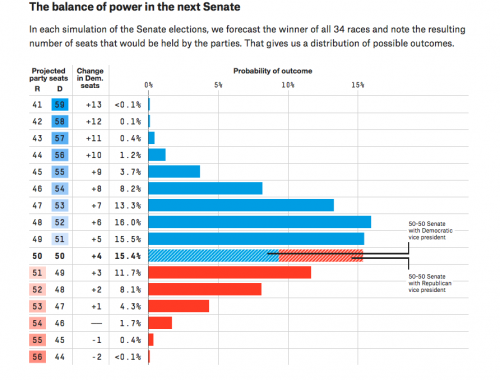
I’ll say that this is approximately a normal distribution with an expected 322 electoral votes for Clinton and a standard deviation of 50. She needs 270 votes to win.* 538 has projected a probability distribution for the outcomes of Senate races, where the vertical axis is the number of Democratic Senate pickups (they need four to take control if Clinton wins, and five if she doesn’t).

Let’s say that the estimated distribution of Senate outcomes has an expected value of 5.5 Democratic pickups and and a standard distribution of 3.
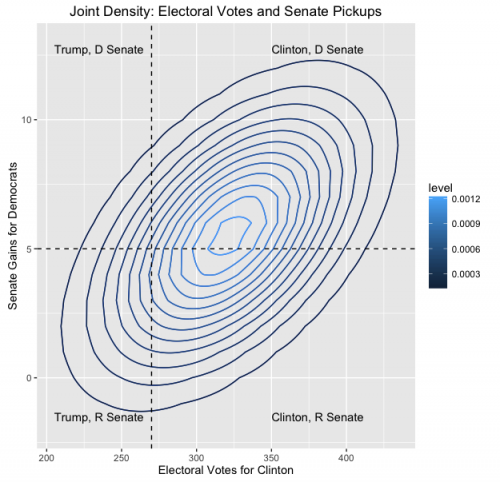
I care about both of these political outcomes, so it’s actually their joint distribution that matters. I’ll assume that the joint distribution is multivariate normal. This means I need to project the correlation r between electoral votes and Senate outcomes. The method for projecting r is proprietary to TheIncidentalEconomist.com, but I can disclose that it required a surveyor’s theodolite, a 4-Tesla Magnetic Resonance Imager, and a volunteer born in the House of Scorpio. Using this method, we estimated that r = 0.531. No animals were harmed in this procedure and the volunteer is expected to recover fully. Here is the projected joint distribution of these outcomes.

Next, we used Ohm’s Law and the rules of contract bridge to derive a function relating my ethanol consumption to the political outcomes. In the interests of reproducible research, here is the R code for this function, which maps electoral votes (ev) and Senate pickups (sen) to alcohol consumption (d_out), measured in grams of ethanol / kg of body weight.
drinking <- function(ev, sen, trump_drinking, senate_drinking){
  d_out <- runif(length(ev))
  d_out <- ifelse(ev < clinton_victory,
                  trump_drinking *
                    (clinton_victory - ev) / clinton_victory,
                  d_out)
  d_out <- d_out +
    ifelse(sen < dem_victory,
           senate_drinking * (dem_victory - sen) / dem_victory,
           0)
  d_out
}
The key point is that ethanol consumption is moderate and random if Clinton wins and the Democrats take the Senate, but if Trump wins it increases linearly with the number of his electoral votes and similarly if the Republicans hold the Senate.
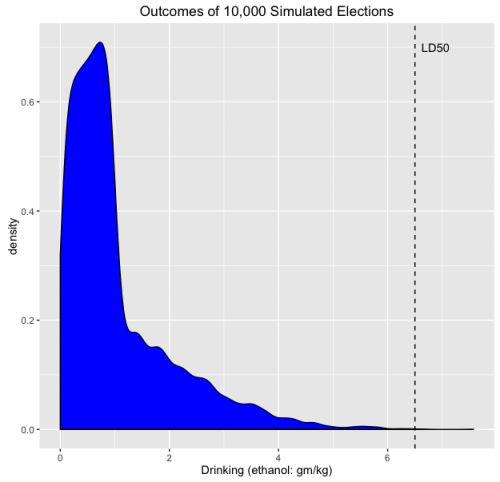
So, then, what’s the estimated probability distribution for my drinking on Tuesday? Here it is, based on 10,000 simulations of joint Electoral Vote/Senate election outcomes.

The median lethal dose (LD50) of ethanol is 6.5 gm/kg, that is, half of the people exposed to this much will perish. How much consumption is that? We’ll say that I weigh 100 kgs (just to make the math easier, no other reason…). So my LD50 is 650 grams. The NIAA says that a “standard drink” has 14 gms of ethanol, so converting units, the lethal dose is 46.4 drinks. There are 24 standard drinks in a 750ml bottle of single-malt scotch, so converting units again my lethal dose is 1.9 bottles.
So I should be okay on Tuesday, although there’s a long tail of disaster. Be safe.
*However, she might need 271 electoral votes, because one of the Washington state electors, a state she will almost certainly win, has said that he will vote for Trump even if Clinton wins the state.

