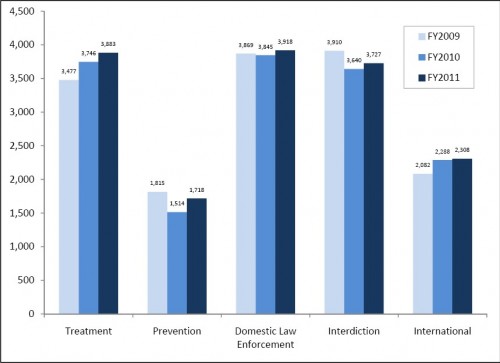
The following figure appears in the Executive Summary of the 2011 National Drug Control Strategy Budget Summary (I know, a summary of a summary). It shows the federal drug control budget (in millions of dollars) for fiscal years 2009-2011.
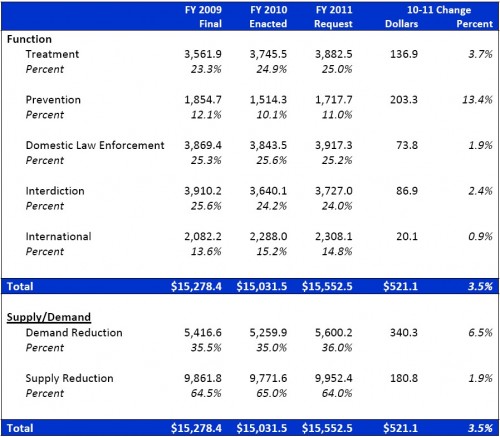
Spending on treatment has been growing. It’s grown 3.7% from FY2010 to FY2011. Prevention has bounced around. Though the FY2011 figure is up 13.7% over the FY2010 level, it is below what was spent in FY2009. Here are the same figures in tabular form. The bottom panel breaks the total into amount targeted at reducing demand versus reducing supply.
Demand reduction is the sum of the treatment and prevention categories. Supply reduction encompasses the others, domestic law enforcement, interdiction, and international. Figures going back to FY2002 show that the demand reduction functions used to receive more funding than they do today, as a proportion of the total. In FY2002, for example, the split was 46% demand reduction and 54% supply reduction.


