
Cecille Joan Avila is a Policy Analyst at Boston University School of Public Health. She tweets at @cecilleavila.
Community Health Centers (CHC) are located in medically underserved areas and have provided necessary care to millions since the 1960s. CHCs serve everyone, regardless of ability to pay. Increased access leads to better health outcomes, including lower mortality rates.
Federal funding to open new CHCs is allocated based medical underservice, a measure of unmet need and access barriers. The measure is primarily attributed at the county-level and accounts for the provider-to-population ratio (per 1,000 persons), percentage of the population over age 65, percentage of population below the Federal Poverty Level, and infant mortality rate. An issue with this approach is that it overlooks variation in need within counties and leaves some individuals with the greatest need for care without access.
New Research
A new study assessed geographic access to CHCs and examined changes in CHC accessibility from 2008 to 2016, time points that correspond with two Obama-era policies that allocated significant funding to support both established and new centers. Researchers focused on Arkansas, Louisiana, and Mississippi, states with similar overall demographics, poor health outcomes, and noteworthy health disparities.
The authors of this study are Leigh Evans, PhD, Martin P. Charns, DBA, Howard J. Cabral, PhD, and M. Patricia Fabian, ScD. They are affiliated with Abt Associates, the Departments of Health Law, Policy, and Management, Biostatistics, and Environmental Health at Boston University School of Public Health, and the Center for Healthcare Organization and Implementation Research (CHOIR) at Veterans Affairs Boston Healthcare System.
Researchers applied a method that could be used to identify pockets of limited CHC accessibility within counties. Additionally, they hypothesized that greater changes in CHC accessibility would be associated with indicators of need (e.g. socioeconomic factors, race, and educational attainment). They did not find evidence of a relationship, suggesting that CHCs established between 2008 and 2016 may not have targeted the areas with most need.
Methods
Researchers compared accessibility to CHCs within counties (census tract) using three different methods, from crudest to most refined: CHCs to population (per 10,000 people), CHC to population within 30-minute driving time from a population-weighted center, and the two-step floating catchment area (2SFCA) method.
The 2SFCA method has previously been used in other areas of health services research but not yet for determining CHC accessibility. This method takes a user-specified catchment area and estimates the supply-to-demand ratio (CHC-to-population). Researchers defined catchment areas by using commute time data, theorizing this mirrors an individual’s willingness to travel to a health center. This also allows for measuring CHC accessibility without regard to county lines, an arbitrary political boundary that does not influence individual behavior. Only brick-and-mortar health centers open year-round that provided primary care services to the entire population were included, as to avoid overestimating access for the general population (e.g. women-only clinics).
Findings
There were no observable relationships between improved access and aforementioned indicators of need, suggesting that CHCs had not been placed specifically to improve accessibility for people who could benefit most from these services. The study also found that the 2SFCA revealed better baseline accessibility than previously estimated, illustrated with Mississippi, below.
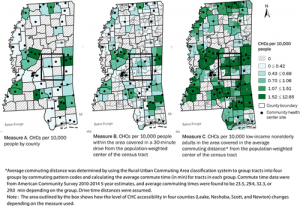
By 2016, overall CHC accessibility increased 192 percent across all three states, and there were fewer tracts with no access at all. State by state, Arkansas saw the largest overall increase in CHC accessibility, followed by Louisiana, and then Mississippi. Despite this improvement, Arkansas still had the highest number of census tracts with no accessibility in 2016. Mississippi, which had better baseline accessibility, had the lowest number of census tracts with zero accessibility by 2016.
Conclusions
Using the 2SFCA method to measure CHC accessibility reveals more concentrated pockets of underservice than when simply looking at county-level distribution. By specifically targeting these areas for new health centers, overall primary care accessibility would increase while also prioritizing those currently afforded the fewest health care resources. If federal funding is allocated based on medical underservice, determining a measure that draws out particularly at-risk areas could be a way to distribute funds more efficiently and equitably.
