
Medicare beneficiaries are living about two years longer today than a couple of decades ago. A fundamental question debated in the literature, however, is whether they are also living healthier. That is, is morbidity more compressed into a period just preceding death or is it being spread out over more years?
This question is addressed in a fascinating, new NBER working paper by David Cutler, Kaushik Ghosh, and Mary Beth Landrum. Using Medicare Current Beneficiary Survey (MCBS) data from 1991 through 2009, they measure mortality and morbidity for over 200,000 people. To control for demographic change, they adjust and apply survey weights in all analyses so that their sample in each year matches the population in the year 2000 by age, gender, and race.
Reflecting the increase in longevity, the investigators found that the proportion of the Medicare population more than 36 months from death has been rising, while the proportion within 12 months of death has been falling (Figure 1, below).

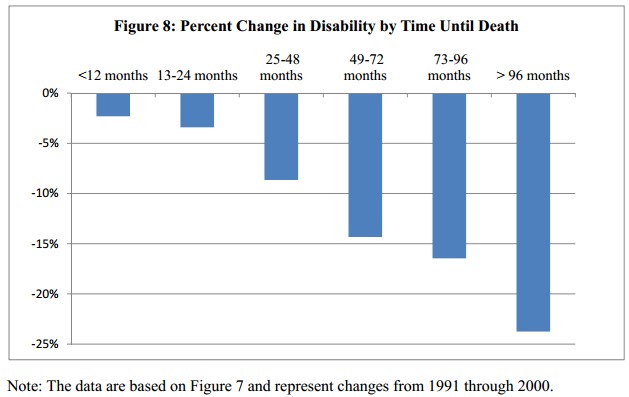
Disability has been decreasing over time in general, but at a greater rate for those further from time of death, as shown in the authors’ Figure 8, below.
Our major conclusion is that time spent in poor physical functioning is being increasingly compressed into the period just before death. Limitations in very severe impairments [] are falling for those not near the end of life, as are more severe functional limitations. Less severe functional limitations are constant, and overall disease prevalence is rising. People have more diseases than they used to, but the severe disablement that disease used to imply has been reduced.
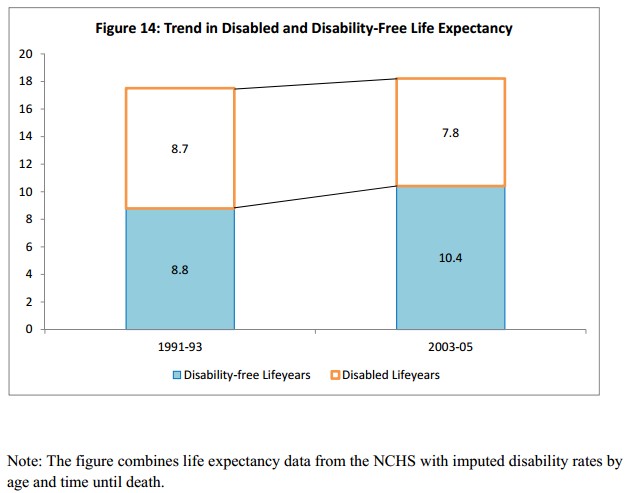
The authors’ Figure 14 illustrates this. Disability-free life-years for Medicare beneficiaries increased from 8.8 years in 1991-1993 to 10.4 years in 2003-2005. Over the same period, disabled life years fell from 8.7 to 7.8 years. Overall, longevity grew as disability declined. This is living longer and healthier.
The story for disease, as opposed to disability, is a bit different, as shown in the authors’ Figure 16, below. Both disease-free years and years with disease increased, though the former increased more.

Our results show clearly that over the 1991-2009 period, disability has been compressed into the period just before death. Disability-free life expectancy rose, and disabled life expectancy declined. Thus, [] morbidity is being compressed into the period just before death. Disease-free survival increased as well, although so did survival with a major disease.
The authors conclude with exactly the right question: to what do we attribute this compression of morbidity alongside decreasing mortality? More precisely, to what extent are the two phenomena due to lifestyle, environmental, or health system factors? Their work does not address these questions, and they are challenging ones. Still, they are the policy-relevant questions and deserve attention.
