I posted a column on samefacts about the importance of something called length-biased sampling. As I noted there, my post was actually inspired by a tweet, in which @AnnieLowrey praised a beautiful New York Times story by Pam Belluck about dementia among geriatric prison inmates. Lowrey expressed surprise that “21 percent of America’s prisoners are serving 20 years to life.” That is indeed a surprising number. It reflects a statistical and operations research principle you may not have considered, but which turns up all over the place in health care and public policy. The principle is called length-biased sampling.
Welfare policy offers another obvious arena to understand these issues. Suppose you went over to the welfare office last Thursday and surveyed every current recipient of Temporary Assistance to Needy Families (TANF). Many of these TANF recipients would have been long-term recipients. Why? Because the people who only needed a little help left the welfare rolls before you had the chance to meet them. The stock or cross-section of TANF recipients you met yesterday was a very different, more needy group than you would have found, had you specifically surveyed every low-income single mom who signed up for TANF that same day.
May Jo Bane and David Ellwood performed some class statistical analyses of long-term welfare dependence that influenced the 1996 welfare reform. (Note to the newbies in this area: Welfare reform replaced a sixty-year entitlement, Aid to Families with Dependent Children, with the avowedly transitional TANF program.) A major argument for welfare reform was that AFDC had become a program for long-term recipients. I can’t get into the complicated politics and ethics of that policy change here. I can clarify a few things with some pretty simple math.
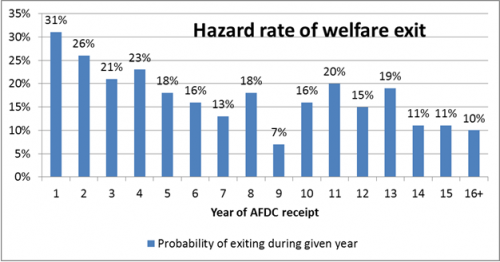
Bane and Ellwood’s terrific (though horribly-titled) book, Welfare Realities: From Rhetoric to Reform, reports the following table (Table 2.1), which applied to recipients in the old AFDC program: (Since it is estimated with actual data, the values jump around a bit for some years. Ignore the possibility that people may re-enter the welfare rolls. Although LaDonna Pavetti’s work underscores the importance of these issues, they only make my underlying points more compelling.)
Now some math: Suppose welfare recipients join the program at some constant rate of λ per unit time. Moreover, suppose that the distribution of total time on welfare is some random variable (T), and that any newly-arriving cohort of recipients follow some probability density function f(T). Now f(T) is NOT what’s provided in the above table. The table tells us the probability of leaving welfare given that one has been on the rolls for a specific period. However, one can calculate f(T) given the above table.
I distributed this table to my masters’ students and had them perform some simulations to find f(T). They used the decision analysis package TreeAge to make the following tree:
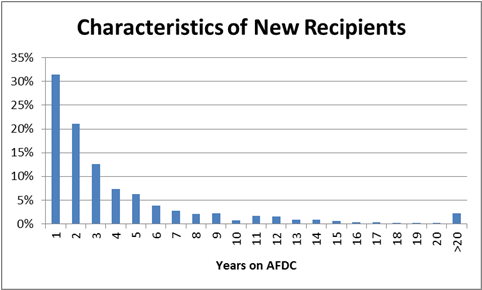
(If you harbor stereotypes about quantitatively-challenged social work students, you are welcome to run these simulations yourself….) Here is what they found:
More than half of new recipients are predicted to exit the program after two years. The distribution f(T) has a mean μ=4.2 years and some variance σ2=28, which corresponds to a standard deviation of about about 5.3 years.
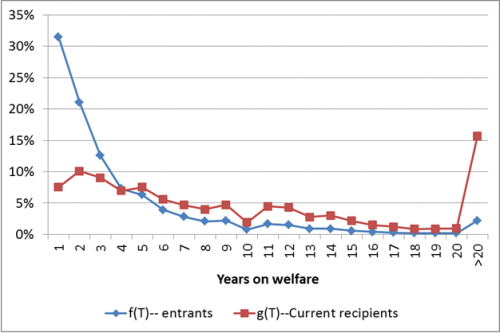
What about the population characteristics of current TANF recipients on a given day (say on January 1, 1996, the year welfare reform was passed)? Welfare “spells” within this group will not follow this distribution f(T). It will be weighted towards long-term recipients who stay on the program for many years. In fact, if g(T) is the distribution of welfare spells within that group, it turns out that g(T)=Tf(T)/μ. The average welfare spell prison term of currently-incarcerated prisoners will be much larger, too, given by the mean M=μ[1+ (σ2/ μ 2)]. Applying what we found above, that implies that M is about 10.9 years—more than twice the mean among new program participants.
Here’s what f(T) and g(T) look like plotted together:
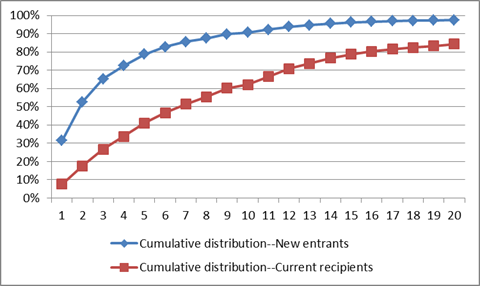
As you can see, the two distributions are really quite different. The differences are even easier to see in the graph below, which shows the probability that recipients will leave on or before a given year.
About 21 percent of new entrants into the welfare system are predicted to remain on the program more than five years—for most people, the identified limit on the receipt of federally-financed TANF aid. Among current recipients, the comparable figure is about 59 percent—nearly three times as large. So one can see that the 20% requirement, perhaps reasonable for an entering cohort, is actually quite punishing when applied to an existing population that inherently includes a much larger proportion of hard cases.
(About two percent of new recipients could be expected to stay on the program for at least twenty years. The comparable figure among current recipients was about 16 percent. The mean and standard deviation associated with g(T) are 10.9 and 10.5 years, respectively. Everything worked out beautifully consistent based on f(T). That’s not too surprising since these results are found with simulated data that has to work out this way after thousands of trials.)
I’ve left much out of this post regarding the mechanics of welfare policy. If you remember that the pre-reform caseload was a length-biased sample of new entrants, you’ll understand something you didn’t before about what’s right and wrong about claims that welfare had become a program for long-term recipients.


