
The US has recently experienced a large increase in opioid abuse and overdose deaths. In JAMA Psychiatry, Bridget Grant and her colleagues report that there have been concurrent increases in alcohol consumption, problem drinking, and diagnosable alcohol use disorder (AUD). AUD is defined in terms of a list of symptoms that include problems in functioning, experiences of craving for alcohol, inability to control drinking, and so on.
OBJECTIVE To present nationally representative data on changes in the prevalences of 12-month alcohol use, 12-month high-risk drinking, 12-month DSM-IV AUD, 12-month DSM-IV AUD among 12-month alcohol users, and 12-month DSM-IV AUD among 12-month high-risk drinkers between 2001-2002 and 2012-2013.
DESIGN, SETTING, AND PARTICIPANTS The study data were derived from face-to-face interviews conducted in 2 nationally representative surveys of US adults: the National Epidemiologic Survey on Alcohol and Related Conditions, with data collected from April 2001 to June 2002, and the National Epidemiologic Survey on Alcohol and Related Conditions III, with data collected from April 2012 to June 2013. Data were analyzed in November and December 2016.
MAIN OUTCOMES AND MEASURES Twelve-month alcohol use, high-risk drinking, and DSM-IV AUD [ = Alcohol Use Disorder].
RESULTS The study sample included 43093 participants in the National Epidemiologic Survey on Alcohol and Related Conditions and 36 309 participants in the National Epidemiologic Survey on Alcohol and Related Conditions III. Between 2001-2002 and 2012-2013, 12-month alcohol use, high-risk drinking, and DSM-IV AUD increased by 11.2%, 29.9%, and 49.4%, respectively, with alcohol use increasing from 65.4% (95% CI, 64.3%-66.6%) to 72.7% (95% CI, 71.4%-73.9%), high-risk drinking increasing from 9.7% (95% CI, 9.3%-10.2%) to 12.6% (95% CI, 12.0%-13.2%), and DSM-IV AUD increasing from 8.5% (95% CI, 8.0%-8.9%) to 12.7% (95% CI, 12.1%-13.3%). With few exceptions, increases in alcohol use, high-risk drinking, and DSM-IV AUD between 2001-2002 and 2012-2013 were also statistically significant across sociodemographic subgroups. Increases in all of these outcomes were greatest among women, older adults, racial/ethnic minorities, and individuals with lower educational level and family income. Increases were also seen for the total sample and most sociodemographic subgroups for the prevalences of 12-month DSM-IV AUD among 12-month alcohol users from 12.9% (95% CI, 12.3%-17.5%) to 17.5% (95% CI, 16.7%-18.3%) and 12-month DSM-IV AUD among 12-month high-risk drinkers from 46.5% (95% CI, 44.3%-48.7%) to 54.5% (95% CI, 52.7%-56.4%).
Here’s the increase in the estimated rates of AUD.
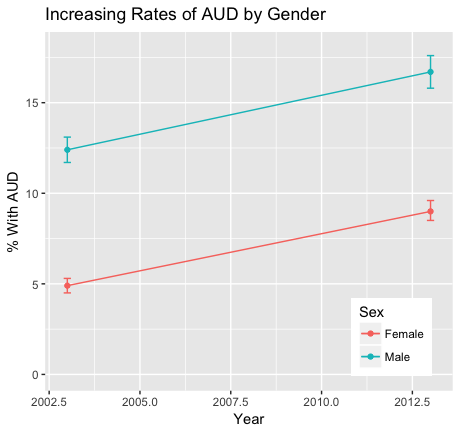
Notice that rates of AUD among women have nearly doubled.
What are the consequences of AUD? Problem drinking contributes to mental and behavioural disorders, liver cirrhosis, and some cancers and cardiovascular diseases. It leads to death and injuries resulting from violence and moving vehicle accidents. Using data from the Global Burden of Disease study, Jurgen Rehm and colleagues estimate that
3·8% of all global deaths and 4·6% of global disability-adjusted life-years [are] attributable to alcohol. Disease burden is closely related to average volume of alcohol consumption, and, for every unit of exposure, is strongest in poor people and in those who are marginalised from society.
Opiate overdoses kill you quickly, so a large increase in non-medical usage will cause a rapid increase in deaths. The harms associated with AUD accumulate slowly, like those of smoking. This means that much of the morbidity, mortality, and excess health care costs of current drinking won’t be seen for a few years.
It’s important that the researchers did not actually observe people consuming alcohol, nor did they measure alcohol levels in the bloodstream. Because alcohol use was self-reported, it’s possible that the reported increase stems from a change in people’s willingness to talk to interviewers about their drinking, rather than a change in drinking per se.*
Let’s suppose that the increase in self-reported AUD is only an increase in the reporting of AUD. Because it’s unlikely that many people would falsely report problem drinking — a highly stigmatized behaviour — that would mean that we are now getting a more accurate estimate of the true extent of the problem. If so, it means that the true rate of AUD is ~9% of Americans aged 18 or older, or roughly 20 million people. This, in turn, is roughly 10 times the number of Americans who use opiates for non-medical purposes. This is a frightening number, even if the prevalence hasn’t changed.
Conversely, if AUD is truly increasing, in parallel to the increase in opiate abuse, and we don’t effectively counter it, then the recent decline in American public health will continue.
*Update: German Lopez notes that there are serious criticisms of the methodology of Grant’s study. If you are interested in this topic, read his article. The key criticism is that the methodology of the underlying survey may have changed from one wave to the next. If so, we can’t be sure whether the reported change in AUD is an actual change in the prevalence vs a change in how it’s measured by the survey.
I strongly agree with German’s conclusion:
Between 2001 and 2015, the number of alcohol-induced deaths (those that involve direct health complications from alcohol, like liver cirrhosis) rose from about 20,000 to more than 33,000. Before the latest increases, an analysis of data from 2006 to 2010 by the Centers for Disease Control and Prevention (CDC) already estimated that alcohol is linked to 88,000 deaths a year — more than all drug overdose deaths combined.
And another study found that rates of heavy drinking and binge drinking increased in most US counties from 2005 to 2012, even as the percentage of people who drink any alcohol has remained relatively flat.
But for now, it’s hard to say if a massive increase in alcohol use disorder is behind the negative trends — because the evidence for that just isn’t reliable.
