New paper out in the Journal of General Internal Medicine. “Out-of-Pocket Spending in the Last Five Years of Life“:
BACKGROUND: A key objective of the Medicare program is to reduce risk of financial catastrophe due to out-of-pocket healthcare expenditures. Yet little is known about cumulative financial risks arising from out-of-pocket healthcare expenditures faced by older adults, particularly near the end of life.
DESIGN: Using the nationally representative Health and Retirement Study (HRS) cohort, we conducted retrospective analyses of Medicare beneficiaries’ total out-of-pocket healthcare expenditures over the last 5 years of life.
PARTICIPANTS: We identified HRS decedents between 2002 and 2008; defined a 5 year study period using each subject’s date of death; and excluded those without Medicare coverage at the beginning of this period (n = 3,209).
MAIN MEASURES: We examined total out-of-pocket healthcare expenditures in the last 5 years of life and expenditures as a percentage of baseline household assets. We then stratified results by marital status and cause of death. All measurements were adjusted for inflation to 2008 US dollars.
Pretty much everyone knows that health care spending at the end of life is large. It’s also well understood that most people at the end of life are covered by Medicare. So while we often talk about this expense being a societal problem, we often assume that individuals aren’t at risk. This study put that assumption under the microscope. The researchers looked at people who were covered by Medicare during the last five years of their life, and then figured out what their out-of pocket health expenses were.
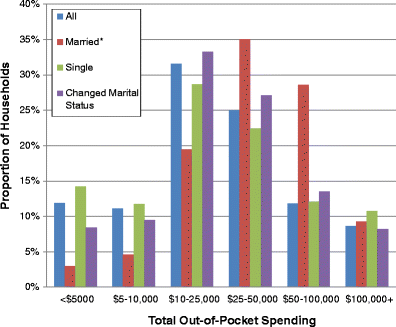
The average individual in Medicare spent $38,688 in their last five years of life. The average couple spent $51,030 s in the five years before one spouse died. But spending wasn’t evenly distributed. For individuals, the median amount spent was $22,885, but the 90th percentile spent was $89,106. That means that ten percent of people had to spend nore than $89,000 out of their own pockets. For couples, the median was $39,759, and the 90th percentile was $94,823.
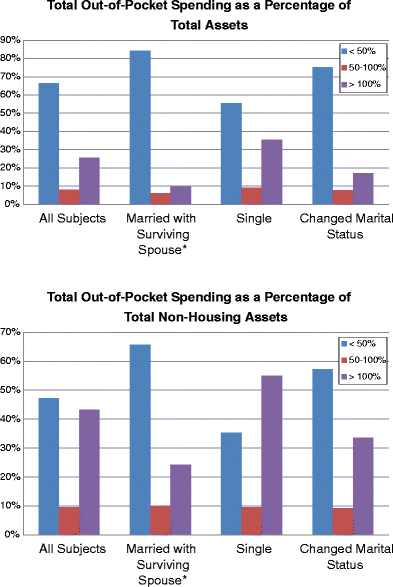
Further analyses showed that these expenditures were more than baseline total household assets for one in four people. That means for 25% of people, these expenses were more than they had. I imagine it drove a lot of them bankrupt.
Now there are limitations to this study, as there are with all studies. These kind of studies are always the focus of disputes. But I’m going to ask you to try and resist telling me that the “25% bankrupt” is over-estimated. I don’t care. Halve it and it’s still a problem. We don’t have a long-term care solution in the US that works. We keep punting on it. The ACA certainly doesn’t get the job done. Health care expenses are still incredibly high for individuals in the US, and it causes a significant number of them financial hardship. Unfortunately, this seems to happen when they are also most vulnerable.


