
Either Medicare Advantage is doing something amazing or data limitations are skewing our view of it. I imagine most people’s priors will drive them to interpret the findings of Bruce Landon and colleagues in one of either of those two ways.
Medicare Advantage (MA) plans have greater flexibility than traditional Medicare (TM). MA can offer more benefits, selectively contract with providers, impose utilization controls (like referral requirements), and implement care coordination programs without large regulatory burdens or new acts of Congress. MA plans must also be responsive to the market, which should provide incentives for higher quality and greater efficiency.
Put it all together and, in theory at least, MA should outperform TM in efficiency and quality. But does it?
Most studies fail to convince one way or the other because researchers are not permitted the same degree of access to MA data as that for TM. For the latter, full claims over many years are available* (though quality measures not derived from claims data are not). For the former, some aggregate measures of utilization provided by plans are usually all we get, and when we get them, they’re not over many years. (However, more quality measures are available from MA plans.)
Comparing MA to TM is like trying to compare two houses, one of which you can live in, the other of which you can only observe through a few keyholes.
In 2006 and 2007 (and only 2006 and 2007), the Centers for Medicare and Medicaid Services (CMS) offered a glimpse of MA through a new keyhole: relative resource use (RRU) data. These plan-level data measure utilization with standardized prices, which removes geographic and MA- or TM-specific price differences. They do so for diabetic patients in both years and those with cardiovascular disease in 2007 only. They are also stratified by age, sex, diabetes type (1 or 2), cardiovascular disease (acute myocardial infarction, congestive heart failure, angina, or coronary artery disease), and the presence or absence of at least one major comorbidity.
Individual-level Healthcare Effectiveness Data and Information Set (HEDIS) data for MA plans—which measure quality of ambulatory care—are also available for those years (and many others). Using 2007 RRU data to measure efficiency and HEDIS to measure quality, Landon et al. constructed similar resource use and quality metrics for a 20% random sample of TM beneficiaries. Quality metrics included, for diabetics, A1C testing in the current year and a diabetic retinal exam in the current or prior year; for both diabetics and patients with cardiovascular disease, LDL cholesterol testing in the current year. These quality metrics are only applicable to and computed for 65 to 75 year olds.
To control for geographic variation in service delivery and quality and demographic differences between MA and TM, the authors weighted the TM sample such that it matched their MA sample demographically within each zip code. This also controls for zip code level socioeconomic differences across the two samples.
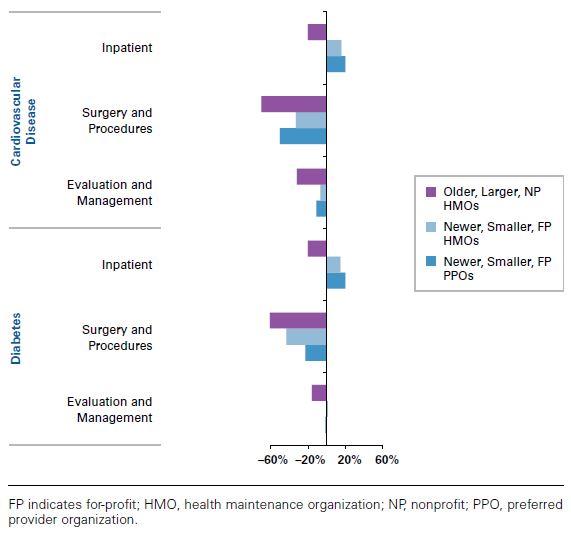
On average, RRU was about 20 percentage points lower for MA than TM. Lower utilization was observed in MA across both disease types and service categories (inpatient, surgery and procedures, evaluation and management). However, as shown in the figure below, for newer (entered the program in 2006 or 2007), smaller (<25,000 enrollees), and for-profit HMO or PPO MA contracts,** RRU was higher in MA than TM for inpatient care.
The chart below combines resource use and a composite of diabetes care quality for MA HMOs vs TM. (A chart with similar patterns for cardiovascular disease is provided in the paper’s appendix.) The former is on the horizontal axis (low spending to the left, high to the right). The latter is on the vertical axis (low spending downward, high upward). Each data point (circle or triangle) is the difference between a specific HMO contract and TM. Larger symbols are for larger contracts (>25,000 members); triangles for new contracts, circles for older ones; blue for nonprofit and purple for for-profit.
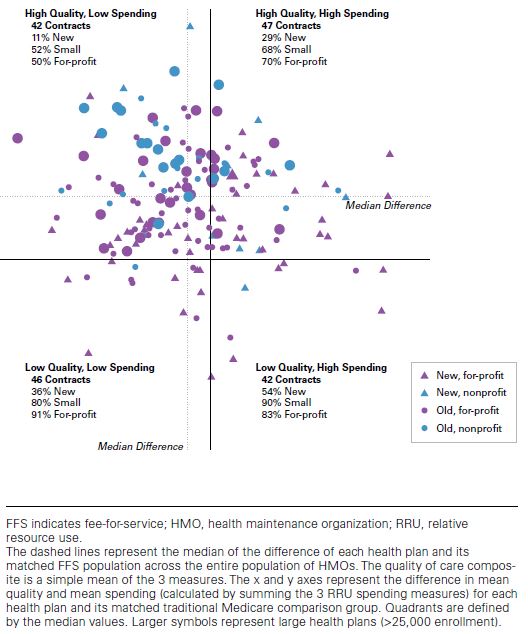
By and large, MA HMOs use fewer resources and provide better quality, though this is more often the case for larger, established ones (relatively more big circles in the upper left and relatively more small triangles in the lower right). (The authors did not include a similar analysis of PPOs. They wrote me that most PPOs were small, new, and for profit, and there were many fewer of them than HMOs in 2007.)
The authors point out several limitations of the analysis:
- It only considered a few aspects of quality, as constrained by data availability.
- It is possible MA plans experienced favorable selection in the time period assessed, even within disease type, and even controlling for demographics, comorbidities, and socioeconomic status, to the extent the authors could and did.
- The data are quite old, from 2007; that’s the latest year available.
To these, we should add:
- Only two disease types were considered, again because of data limitations.
- It is possible MA plans upcoded relative to TM such that the MA cohort appeared relatively sicker, which after adjustments, might make resource use look relatively lower.
- Beneficiaries with “concomitant specified dominant medical conditions including active cancer, end-stage renal disease, human immunodeficiency virus/AIDS, and organ transplants” were not included in RRUs and, hence, excluded from the analysis. It’s possible MA plans provide disproportionately inefficient or poor care to such beneficiaries.
- The analysis included all ages above 65 but the contract HEDIS quality measures used in the analysis are only applicable and computed for ages up to 75, so it’s possible there are some offsetting quality differences for older enrollees.
- Within zip code socioeconomic differences could not be controlled for.
- PPOs were excluded from the quality/efficiency analysis (the figure just above).
Even if the results accurately depict the efficiency and quality of MA, relative to TM, it must be emphasized that MA plans were paid well above their costs in 2007 and are still paid above them today, though not by as much. In other words, whatever their efficiency, taxpayers are not benefiting; whatever their quality, that comes at a higher price.
Still, either MA is doing something amazing—broadly providing substantially better care with less utilization, which is something few initiatives in TM have ever been able to do—or the results are (or are in part) artifacts of analytic limitations. The best way to decide which is to do more research with more complete data. Until we’re offered more than selected glimpses through keyholes at MA, we may never get the chance to do that.
* These days, with the exception of any substance use disorder related claims.
** The analysis included HMO and PPO enrollees, not those in other plan types (PFFS, special needs plans, cost plans, etc.) because those other plan types are both small and exceedingly different.
