
Here’s my take on the Raj Chetty and David Cutler JAMA paper on the association between income and life expectancy in the US. It’s very simple. The paper is important because income and life expectancy are fundamental constituents of a good life and because the authors have data on the entire population. Their results show that in the US the linked and evolving distribution of these goods is profoundly unjust.
Chetty and colleagues report that over the last 15 years,
The annual increase in longevity was 0.18 years for men (which translates to an increase of 2.34 years from 2001-2014) and 0.22 years for women (an increase of 2.91 years from 2001-2014) in the top 5% of the income distribution. In the bottom 5% of the income distribution, the average annual increase in longevity was 0.02 years (an increase of 0.32 years from 2001-2014) for men and 0.003 years (an increase of 0.04 years from 2001-2014) for women (P < .001 for the differences between top and bottom 5% of income distributions for both sexes).
Across the entire income distribution, it looks like this:
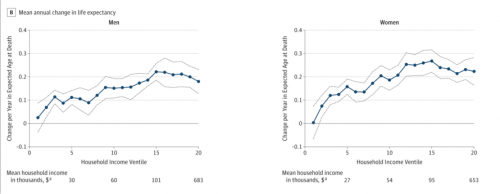
The horizontal axes are the percentile* ranking of households by income at age 40. The vertical axes are the increases in life expectancy at age 40 per year. The bottom ventiles of the income distribution have experienced no gain in life expectancy. Life expectancy growth increases the farther up you are in the income distribution (until it plateaus at about $100,000/year).
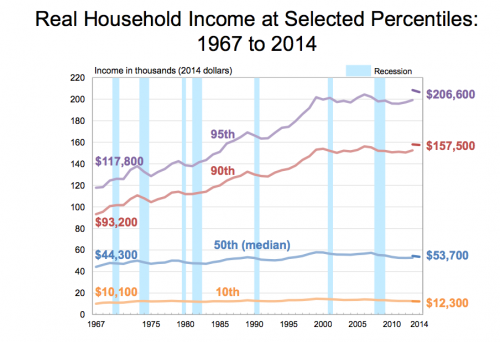
Now look at US Census data below on the growth in household income by selected percentiles. The orange line at the bottom of the graph is the same segment of the income distribution as the leftmost two points on the life expectancy graphs. Their income has grown at 0.4% per annum over the last 47 years and appears to be trending down in the last 15 years, whereas the 95th percentile has experienced a thrilling 12% per annum growth.
This is unjust. The core of John Rawls’ ethical philosophy was that the basic institutions of society should first secure liberties for all and then guarantee everyone equal opportunities to compete for office or position. These commitments will necessarily result in inequalities in social and economic outcomes. However, these inequalities should function so as to
be to the greatest benefit of the least advantaged members of society.
The Chetty et al. data show that, to the contrary, the inequalities are of benefit to the most advantaged. The least advantaged get nothing.
You may not share this view of justice. But if you agree that social and economic inequalities are justified when the rising tide lifts all boats, then what Chetty and his colleagues show is that how matters have evolved is starkly at variance with that ideal.
*For some absurd reason, Chetty et al. have scaled the income ranks in this graph in freaking ventiles (twentieths) where the authors’ text (like any sane person) expressed the ranks in percentiles.
