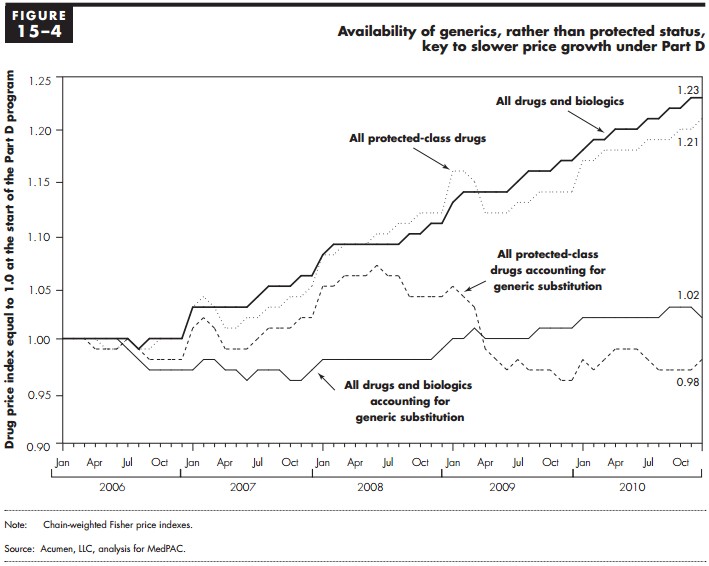
The chart, from MedPAC (PDF), is below. It doesn’t report anything particularly new. I just like the presentation. It requires a bit of explanation.
Measured by individual national drug codes (NDCs), Part D drug prices rose by an average of 23 percent cumulatively between January 2006 and December 2010. At the same time, Part D sponsors have had success at encouraging enrollees to switch from brandname drugs to generic substitutes. As measured by a price index that takes this substitution into account, Part D prices grew cumulatively by 2 percent between January 2006 and December 2010.
The rules governing Part D plans require them to cover “all or substantially all” drugs in six protected classes. The chart also illustrates price growth for those classes.
As measured by individual NDCs, prices for drugs in the six protected classes showed a trend similar to that for all Part D drugs, rising by a cumulative 21 percent over the five-year period.