Since the release of the results of the 2011 Kaiser/HRET Employer Health Benefits Survey, I’ve been getting a lot of questions about what drives premiums in general and what caused the steep rise this year (8% for individual and 9% for family coverage, up from 5% or lower the last few years). More is known about the former than the latter, but that won’t stop me from speculating about this year’s increase. However, I’ll save that for another post, to appear at noon.
Premiums are not the same thing as health care spending, but they are related. So, let’s start with some history of health care spending growth. Last month, on the Health Affairs blog, Charles Roehrig, illustrated and explained historical health spending growth relative to “potential GDP” (what GDP would be at full employment). It’s clear from a detailed year-by-year time series graph he provides that health spending growth has been low in historical terms since about 2004. In fact, it’s been comparable to the spending growth in the 1990s, the golden age of commercial market cost control. What are we complaining about?
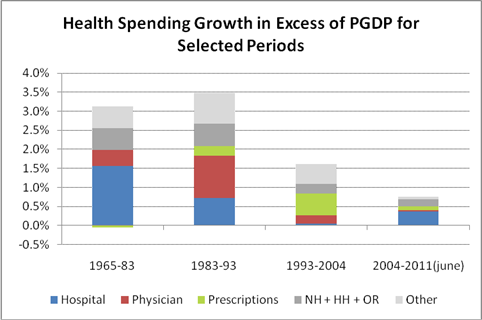
To keep this post shorter than it otherwise would be, I’m not providing that year-by-year graph here (click over to Roehrig’s post for it). However, the stacked bar graph for selected periods below illustrates the same thing and is easier to read. Since 2004, we’ve been in an era of remarkably low health spending growth. Relative to the prior period (1993-2004), the only type of spending that has grown faster since 2004 is for hospital services, but still at a rate low compared to periods before 1993.
You’ll read in the news that low health spending is due to the economic downturn. That can’t be the full story because, as shown, health spending has been growing relatively slowly since 2004, several years before the economic woes.
The health spending in the above chart includes that of Medicare and other public payers, not just the commercial market or private plans. Due to the growth in the elderly population, total Medicare spending growth has outpaced that of other payers over the last decade. Medicaid growth rates have been close to the national total growth rate too.* (See NHE data (pdf).) So, we can infer that the slow down in spending growth illustrated above has occurred for employer plans.
This goes a long way toward explaining why employer premiums have grown at relatively low rates since 2003. It’s no where near the full story though. For one thing, premiums depend, in part, on spending per insured individual, not just total national spending. I’ll get into that, and other drivers of premium growth, in my noontime post.
* Medicaid growth was negative in 2006. I’m guessing that’s due to the transfer of liability to Medicare for prescription drugs for Medicare-Medicaid dual enrolless.
UPDATE: The follow-up post is here.


