Survey research in health policy is having its moment, assuming abstruse methodology is ever vogue enough to have a “moment”: yesterday’s news about the Census revising its widely-used Current Population Survey sparked one of the nerdier rounds of Obamacare controversy we’ve seen yet. Relevant to this moment is a new paper (gated) from Laura Skopec, Thomas Musco, and Benjamin Sommers.
Setting aside sentiments about the CPS update, it’s always been the case the researchers will rely on more than one data source to triangulate the impact of the Affordable Care Act. To do that, you need to understand the data sources. Skopec et al focus on the Gallup-Healthways WBI survey, sizing it up against the Current Population Survey, the American Community Survey, the Medical Expenditure Panel Survey, the National Health Interview Survey, and the Behavioral Risk Factor Surveillance System. Gallup puts out periodic reports on the uninsured (among other things), but their data is also available for researchers to purchase.
One unassailable perk of Gallup’s surveys is turnaround time: national-level data is available for analysis within a week of collection (state-level estimates are only made available twice a year, though). For reference, yesterday’s fracas about CPS revisions centered on data we’ll get in September. Data about calendar year 2013.
Gallup had a robust sample size of 355,000, which was reduced to about 177,000 starting in 2013. That’s not the ACS’s 3 million, but it was higher than CPS (200,000—2013 data isn’t available from CPS yet, so we haven’t compared Gallup’s smaller sample size against Census estimates) and the most detailed health surveys (NHIS has a sample of 100,000, MEPS 35,000).
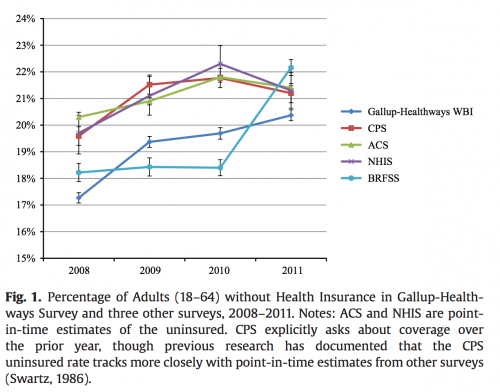
From 2008 through 2011, Gallup exhibited a lower baseline rate of uninsured than CPS, ACS, and NHIS, but trends over time were relatively consistent. The chart below tracks reported rates of uninsurance among the surveys examined by the authors.
It’s not all good news, though. One concern the authors cite is “frequent methodological and question changes [that] introduce a level of uncertainty not generally encountered in government surveys.” These changes are more opaque and more egregious than changes to government surveys—for example, Gallup halved their sample size starting in January 2013 to divert more resources to international polling. That kind of change is a huge blow to statistical power and precision.
This criticism of Gallup isn’t naive to the CPS’s upcoming changes:
While government surveys also change over time – in particular some government surveys are introducing question changes to better detect the coverage and access effects of the Affordable Care Act – these changes tend to be approached with caution and attention to minimizing breaks in trend. In addition to WBI’s unpredictability, the most concerning methodological limitation of the survey is its response rate of 11%. While this rate is similar to that of other telephone surveys, it is far below those of the government surveys (which range from 50% to 98%).
The way that Gallup reports income is also likely to frustrate health services researchers: instead of reporting specific dollar amounts (treating income as a continuous variable), Gallup records one of ten discrete income ranges. Painting income in such broad strokes obscures the thresholds built into the ACA, making it incredibly difficult to draw inferences about key topics like Medicaid eligibility and subsidy generosity.
One of the most troubling aspects of Gallup’s data is their Medicaid estimates: these come in at about half the enrollment in government surveys, a margin of four to five percentage points. It seems likely that some number of Medicaid beneficiaries are mistakenly reporting “other/non-group” coverage; Gallup has an unusually high proportion of respondents in that category. Given that, their data on enrollment in Medicaid and the private market should be used with caution.
All in all, it’s a mixed bag: There are serious limitations for empirical research, but Gallup data seems adequate for the rough cuts of information that our impatient news cycle seems to demand:
Gallup-Healthways WBI data seem particularly well-suited for real-time analyses of certain changes in health care trends that do not require distinguishing between different types of insurance coverage, such as whether the ACA had reduced the number of uninsured adults in the U.S., similar impacts of state expansions, and the impact of these changes on access to care.
Update: This post was modified to reflect that Gallup’s sample size changed (from 355,000 to 177,000) starting in 2013.
Adrianna (@onceuponA)


