If you’re not into instrumental variables (IV) econometrics and/or power calculations don’t bother reading this post. I’m not even going to try to make it widely accessible. But if you are an econ/biostats type, I have a question for you. I want to know if you have seen anything like the following in any paper or book. I am looking for a supporting reference, if it’s out there.
One thing that came up in the power calculation discussions I’ve been hosting here lately is that instrumenting for the treatment indicator reduces power. It’s convenient to do a power calculation ignoring that fact, pretending as if you are running a randomized controlled trial. But if you’re really running an IV, how much more sample do you need to achieve adequate power? Or, put another way, how much does the IV sap your power?
Every time I’ve seen this question raised, the next thing I see is that it’s too complicated to figure out. Except that it turns out that, in the linear case at least, it really isn’t. My colleague Steve Pizer did the math and got a nifty little result. To convey it, it’s simplest to consider a two-stage least squares (2SLS) set up with no controls, like this:
X = Zγ + ν (first stage)
Y = Xβ + ε
where X is the vector of treatment indicators, Z is the vector of instruments, Y is the vector of outcomes, and all the usual assumptions for 2SLS apply. (To consider a case for which there are additional control variables, first regress the treatment, instrument, and outcome variables on them and compute the residuals. Then use the above on these residual versions. The result below still works out, with one change.)
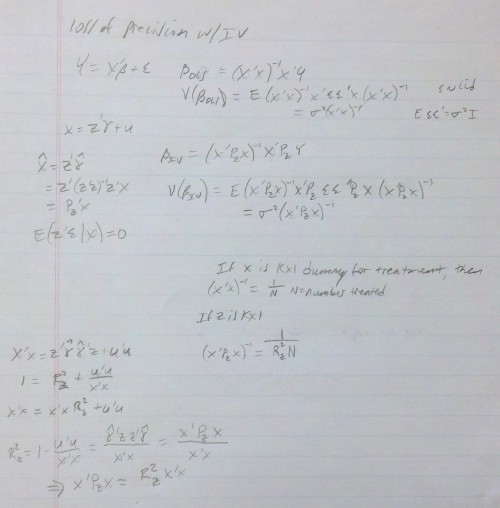
Assume you have done a power calculation that suggests you need N observations in the treatment group* to obtain a sufficiently powered estimate of the effect of treatment X on outcome Y, pretending it’s a randomized trial (no IV). Steve showed that the IV setup requires N/R² observations, where R² is the “R-squared” of the first-stage shown above. That is, the less predictive power the first stage has (the lower its R²) the more observations you need, which is intuitive. Also, if the instrument is the treatment indicator (a limiting case), R² is obviously 1, and you get back the result that you need N observations for sufficient power. Finally, if your instrument has no predictive power, R² is 0, and you need infinite observations, which is sensible. (In the case for which you did this in the residual space to handle additional controls, the number of observations required is X’X/R². It just turns out that X’X = N when X is a vector of treatment indicators.)
This is such a simple, appealing result that someone else must have written it down in some book or paper. My question for you is, who and where?
Steve’s derivation is below. I can’t be bothered to type up all the equations because it’s a pain. I apologize for his handwriting, though he may not.
* Go ahead and assume N observations in the control group too, though I think this all works just fine if the power calculation is done such that the control group size is some specified proportion of the treatment group size, like rN for some scalar r > 0.


