I took a break from house cleaning (really!) and saw the following by Ezra Klein:
A number of you have written to ask what I think of Paul Krugman’s column attacking Paul Ryan’s budget. As far as Krugman’s policy critique goes, I agree. I’d refer people back to my post “Paul Ryan’s budget proposal does not balance the budget,” which uses the same Tax Policy Center data that Krugman does. The question comes down to whether Ryan is serious about increasing the revenues in his plan from 16 percent of GDP to 19 percent of GDP. He says he is, but as far as I know, he has not modified his proposal to reflect that.
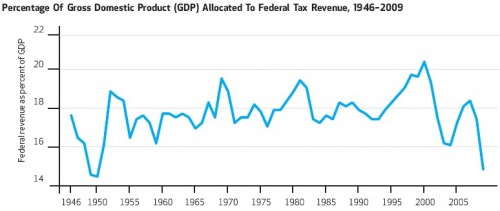
That’s when I recalled a graph from Joe Newhouse’s recent Health Affairs paper of a time series of federal tax revenue relative to GDP. Here it is:
What’s the point? The point is 19% is high. The norm seems to be in the 16-18% range. It should come as no surprise that it will take historically high tax revenue to balance the budget.


