
One of my fist big efforts on this blog was a ten point series on health care spending in the US. It also led to this video, which led to Healthcare Triage. It’s not surprising, therefore, that I have an ongoing interest in spending on health.
A recent publication in JAMA got into the weeds of where that money has gone:
Importance US health care spending has continued to increase, and now accounts for more than 17% of the US economy. Despite the size and growth of this spending, little is known about how spending on each condition varies by age and across time.
Objective To systematically and comprehensively estimate US spending on personal health care and public health, according to condition, age and sex group, and type of care.
Design and Setting Government budgets, insurance claims, facility surveys, household surveys, and official US records from 1996 through 2013 were collected and combined. In total, 183 sources of data were used to estimate spending for 155 conditions (including cancer, which was disaggregated into 29 conditions). For each record, spending was extracted, along with the age and sex of the patient, and the type of care. Spending was adjusted to reflect the health condition treated, rather than the primary diagnosis.
Exposures Encounter with US health care system.
Main Outcomes and Measures National spending estimates stratified by condition, age and sex group, and type of care.
Researchers went through many data sources, including government budgets and records, insurance claims, surveys of households and facilities. Specifically, they used 183 sources to look at spending for 155 conditions (cancer took up 29 of them). For each record of spending, they also looked at the age and sex of the patient, as well as what care they received.
Between 1996 and 2013, more than $30 trillion was spent on personal health care. Let that sink in for a minute or two. Over that time period, spending increased between 3% and 4% annually for most age groups. The highest growth was in emergency care (6.4%) and prescribed retail pharma (5.6%). Inpatient care, on the other hand, went up 2.8% and nursing facility care went up 2.5%.
Let’s focus on 2013, the most recent data. In that year, diabetes accounted for the highest health care spending, with more than $101 billion. Of that, 58% was on drugs and 24% on ambulatory care. Number two was ischemic heart disease, with spending of more than $88 billion.
Neither of these was too surprising to me, but number 3 was. Low back and neck pain – with spending of more than $87 billion.
As you might expect, spending by condition varied by age, sex, year, and type of care. But it pretty much kept going up and up and up. For 143 of the 155 conditions, spending increased between 1996 and 2013. Spending increased the most on diabetes (#1 in 2013) and low back and neck pain (#3 in 2013).
Spending was highest for those between 50 and 74 years. Then, it starts to go down, as the population decreases. But if you break it out by age, spending on women >85 is actually the highest category overall.
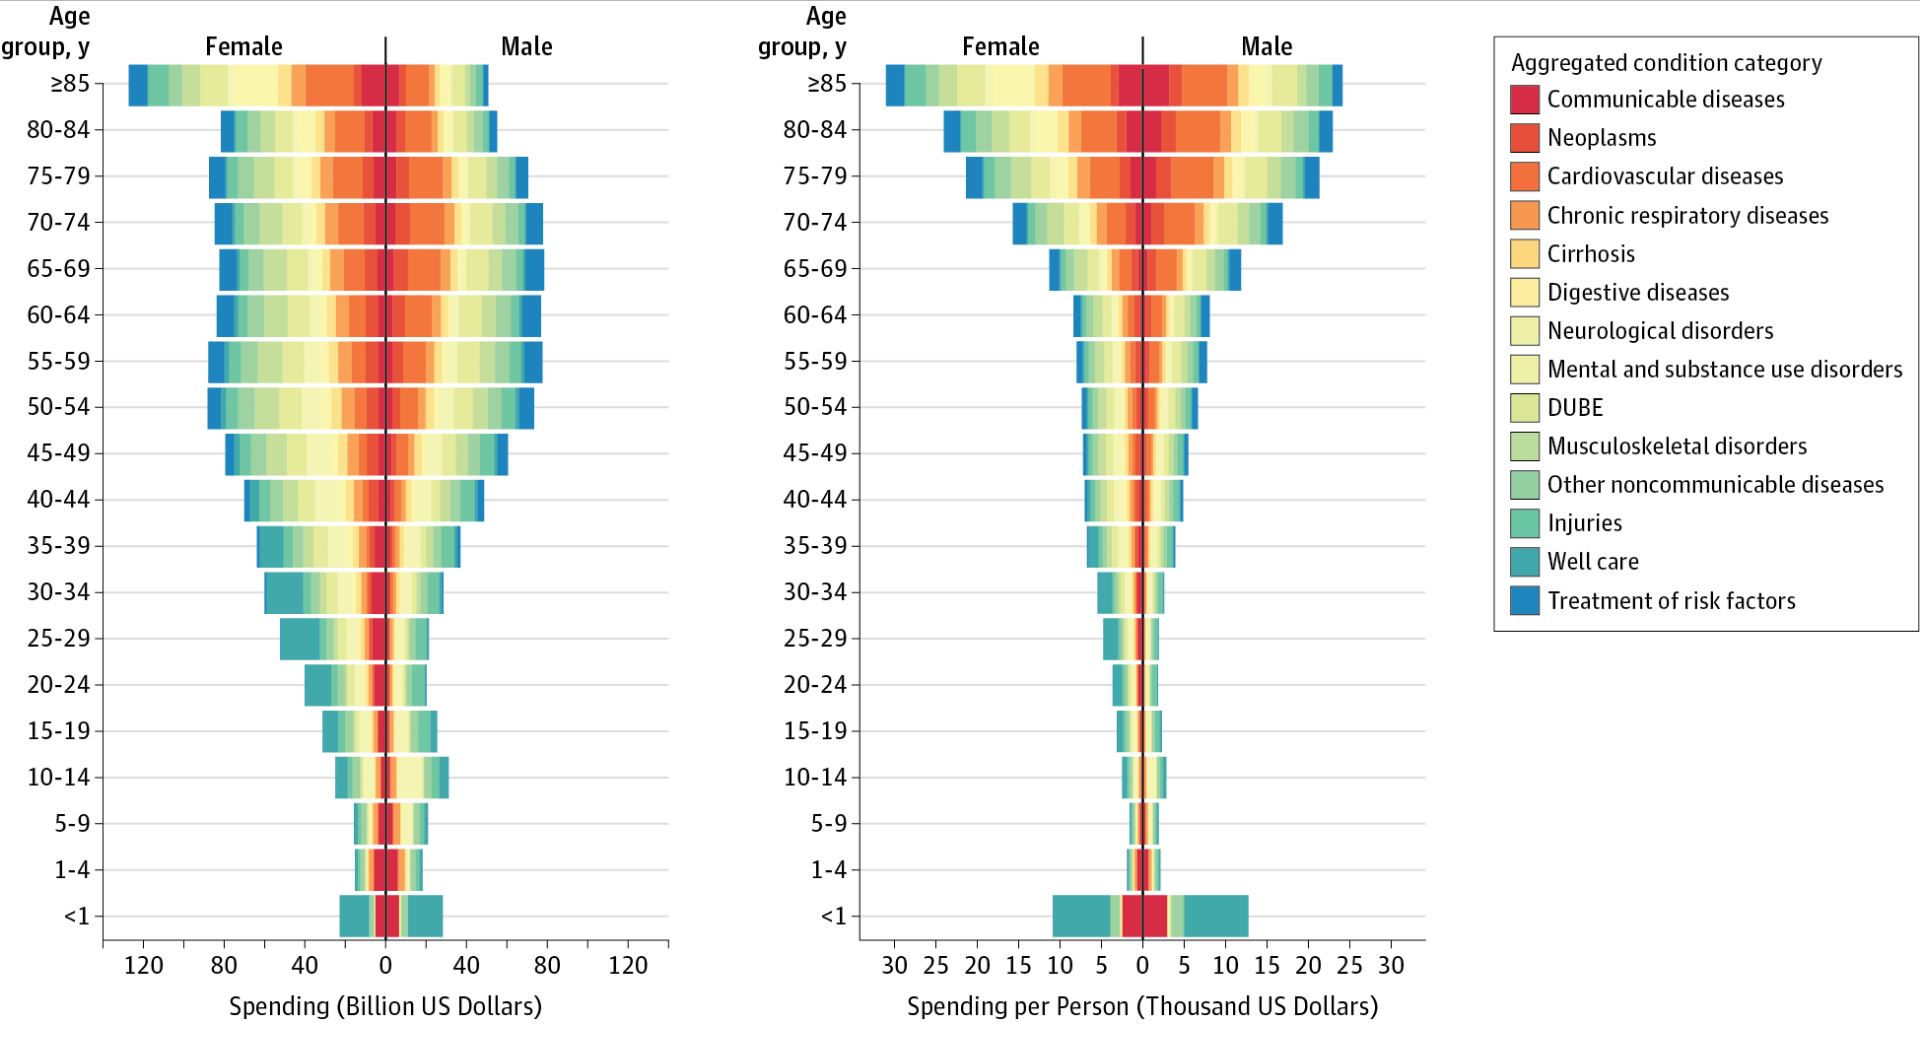
So what do we take home from this? I guess that depends on your interests. I was intrigued by the causes of health care spending. Chronic disease (diabetes, heart disease, COPD, cerebrovascular disease) wasn’t a surprise. A lot of this was actually modifiable by lifestyle changes. Risk factors account for a lot of spending. Hypertension and hyperlipidemia alone were responsible for more than $135 billion of spending in 2013.
But a lot of the spending was due to things like low back and neck pain, osteoarthritis, musculoskeletal disorders, and neurologic disorders associated with pain and muscular dystrophy. These differed from the chronic diseases in that spending was highest for working-age adults, not the elderly.
The bottom line, as I learned so long ago, is that health care spending is complicated. Getting a handle on it will be, too.
