Two years ago, I summarized the evidence that suggests treatment for substance use disorders (SUD) is overwhelmingly cost-effective. The emphasis in that post was on the returns to treatment, not on damage and cost of the disorders. More recently I blogged about some of the costs of prescription painkillers and the opioid epidemic. In this post, I will focus again on some of those costs, relying on a graphic from the Centers for Disease Control (CDC), reproduced below.
But first, to review, here’s a bit of what I wrote about the cost-effectiveness of SUD treatment:
Researchers have found that SUD treatment is associated with a substantial offset effect, a subsequent reduction in emergency department and inpatient hospital use and costs. In a review of eleven studies, seven of which included sufficient information to calculate benefit-to-cost ratios, McCollister and French (2003) found the range to be 1.33 to 23.33, attributing the majority of benefit to reductions in crime, a large minority to increases in income, and a smaller minority to avoided health spending.
A recent paper in Medical Care Research and Review provides new evidence that SUD treatment more than pays for itself. Thomas Wickizer, David Mancuso, and Alice Huber study the expansion of SUD treatment financed by the Washington State Medicaid program in the mid-2000s. […] For an $18 million investment by the state, treatment-related savings to the Medicaid program alone totaled $17 million.
Focusing on prescription painkillers alone, the CDC illustrated some of the damage and costs for which they are responsible (and, yes, let us acknowledge that they are also of tremendous help to some patients). Death from overdose is merely the tip of the iceberg:
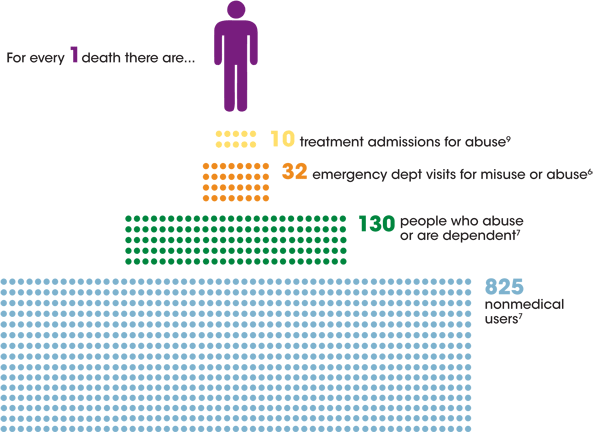
As good as this chart is, it doesn’t get at the other, social costs of drug use/abuse, including those related to crime, criminal justice, absenteeism from work, job loss, and the emotional and social damage to families and communities. I’ll say more about those next month.
References cited in chart [hyperlinks added]
4. CDC. Vital Signs: Overdoses of Prescription Opioid Pain Relievers—United States, 1999-2008. MMWR 2011; 60: 1-6
National Vital Statistics System. Drug overdose death rates by state. 2008.
6. Substance Abuse and Mental Health Services Administration. Drug Abuse Warning Network: selected tables of national estimates of drug-related emergency department visits. Rockville, MD: Center for Behavioral Health Statistics and Quality, SAMHSA; 2010.
7. Substance Abuse and Mental Health Services Administration. Results from the 2010 National Survey on Drug Use and Health: volume 1: summary of national findings. Rockville, MD: Substance Abuse and Mental Health Services Administration, Office of Applied Studies; 2011.
9. Substance Abuse and Mental Health Services Administration. Substance abuse treatment admissions by primary substance of abuse, according to sex, age group, race, and ethnicity 2009 (Treatment Episode Data Set).