
More than a decade ago, I got an email from an old college friend, the gifted pediatrician and health services researcher Richard Strauss. Rick worked in pediatric GI, and he did a lot of work with overweight kids. He was noticing increasing numbers of really obese kids in his practice. We decided that we should pull some data from the National Longitudinal Survey of Youth 1979 (NLSY79) to investigate. We found dramatic increases in child overweight between 1986 and 1998.
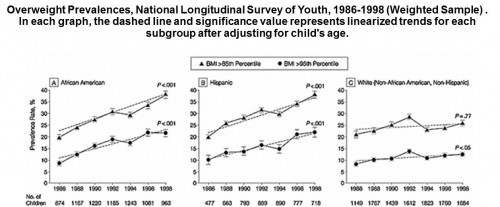
We also documented the emergence of race/ethnic and class disparities that hadn’t existed at the beginning of the time period we studied. We noted, within the confines of our tight conclusion section, some of the major contributing factors: Declining relative prices of fattening foods, rising costs of parental time that might be used for healthy food preparation, declining physical activity among children and youth.
Our analysis appeared in JAMA in 2001. Many more elaborate papers have appeared on the topic since then. I think JAMA published our simple paper because we produced one killer Powerpoint slide, shown above. Still, we were among the first to use nationally representative data in such a prominent forum. So our paper had an impact in child health policy. At last count, it has been cited 582 times in the peer-review literature. I remain grateful to Rick for initiating that work.
We had no specific grant to fund it. We employed zero research assistants. Our paper could have been written by a smart college senior. In a way, that’s the point of this column.
We could do that work because we could download high-quality, nationally representative NLSY79 data. Youth born between 1958 and 1964 (and subsequently many of their own children) were followed over time, in some cases interviewed 25 times over the past 30 years.
NLSY79 data include kids’ heights and weights, well-implemented standardized tests, household composition and incomes, a variety of earnings records, self-reported health status and health behaviors, and much more. These rich datasets with high response rates allow researchers and policymakers to address many important questions people might not have thought of when the data were collected, and perhaps could not be answered any other way: Are variations in state alcohol taxes associated with increased youth sexual risk behavior? Are local variations in HIV prevalence associated with corresponding variation in HIV risk behaviors among youth?
The longitudinal nature of the data is especially valuable. Some questions can’t be answered unless you follow people over time. For example: How do women’s wages change they divorce or have a child? The ability to compare cousins and siblings is also valuable. In a famous set of papers, Janet Currie and Duncan Thomas compared academic outcomes of children who attended Head Start with those of older siblings who did not access the same services. A beautiful re-analysis of the (NLSY) data analyzed in the Bell Curve showed that family background is more important than simple analyses had previously suggested.
The National Longitudinal Surveys (which include the NLSY79 and several others, including comparable studies of a more recent cohort known as NLSY97) have been used for some 6,000 published research papers in economics, education policy, sociology, survey design, and public health. This list includes some modern classics. It also includes work that has influenced important public policies, altering the way American society spends billions of dollars every year for job training, preschool education, community college, welfare policy, assistance to veterans, immigration policies, and youth development.
Everyone in public policy would give their own “top ten” list of important NLS papers. Our work at the University of Chicago Crime Lab is strongly influenced by James Heckman’s research—largely based on the NLSY79-on the importance of “non-cognitive” social-emotional skills.
Heckman is also famous for other NLSY79 research, as co-author with Stephen Cameron, regarding the “non-equivalence of high school equivalents.” Cameron and Heckman demonstrated that GED degree recipients gain surprisingly little economic benefit from such certification, when compared with high school dropouts who completed the same years of actual schooling.
Although the NLS surveys have been well-designed and fielded very well, their funding is now under attack. An email from the NLS research team landed in my box, quoted below:
The National Longitudinal Surveys (NLS) program faces the biggest threat in its 47-year history as a result of reductions in the 2012 and 2013 Bureau of Labor Statistics (BLS) budgets. ….
We recently learned that we will lose $4.7 million (80% of our remaining budget) in the current fiscal year and $6 million (55% of our annual NLS budget from BLS) in fiscal year 2013.
BLS received virtually the same congressional appropriation in fiscal year 2012 as in 2011, and expects a $9.1 million increase in 2013. Despite avoiding a hit to its overall budget, BLS decided to reduce previously-committed funding to the NLS.
BLS mistakenly believes the NLS program can absorb this massive budget cut by (a) moving to triennial fielding of the NLSY79 and NLSY97; (b) dropping the Hispanic over-samples in both surveys; and (c) eliminating created event history variables. In fact, we will be unable to carry out these scaled-back activities: the cuts leave us with insufficient funds to field additional rounds of the NLSY79 and NLSY97, or to complete even the most rudimentary data releases….
Obviously, these NLS team leaders are not unbiased observers. They nonetheless have a strong case. One of them, my normally mild-mannered University of Chicago colleague Dan Black adds the following via email:
Raiding the NLS program to pay for other programs at the BLS shows a striking disregard for social science research and the hundreds of millions of dollars already invested in the NLS program….
This has been done with no consultation with Congress, with the research community, with the project team, or with any other stakeholder. The project has continued to be an outstanding success in terms of response rates by those surveyed, one of the most widely used and highly prized data sets in the Federal Statistical System. There is no expressed rationale or justification for the destruction of this federal resource that has been in existence since 1966.
These surveys aren’t cheap. They cost several million dollars every year to do right. They are also a bargain. By spending $6 million per year for high-quality national surveys, we increase the chances that we will do a better job as we spend maybe 2,000 times that figure for preschool services to low-income children, not to mention even greater amounts for public assistance benefits, community colleges, and more.
No major constituency fights for high-quality social science research. There needs to be. We are blinding ourselves with these budget cuts.
(HAP)
