
That’s the wonderful title of a post by Eli Perencevich (Iowa), in one of my must-read blogs, Controversies in Hospital Infection Prevention. Hospital epi is filled with single-hospital observational studies. Did the intervention cause the infection outbreak to diminish, or was it on the wane in any event and the intervention just rode the epi curve to glory? (see also: regression to the mean). Some hospital infections show seasonal patterns, making interventions in September appear to be more successful than the same interventions in May. From the post:
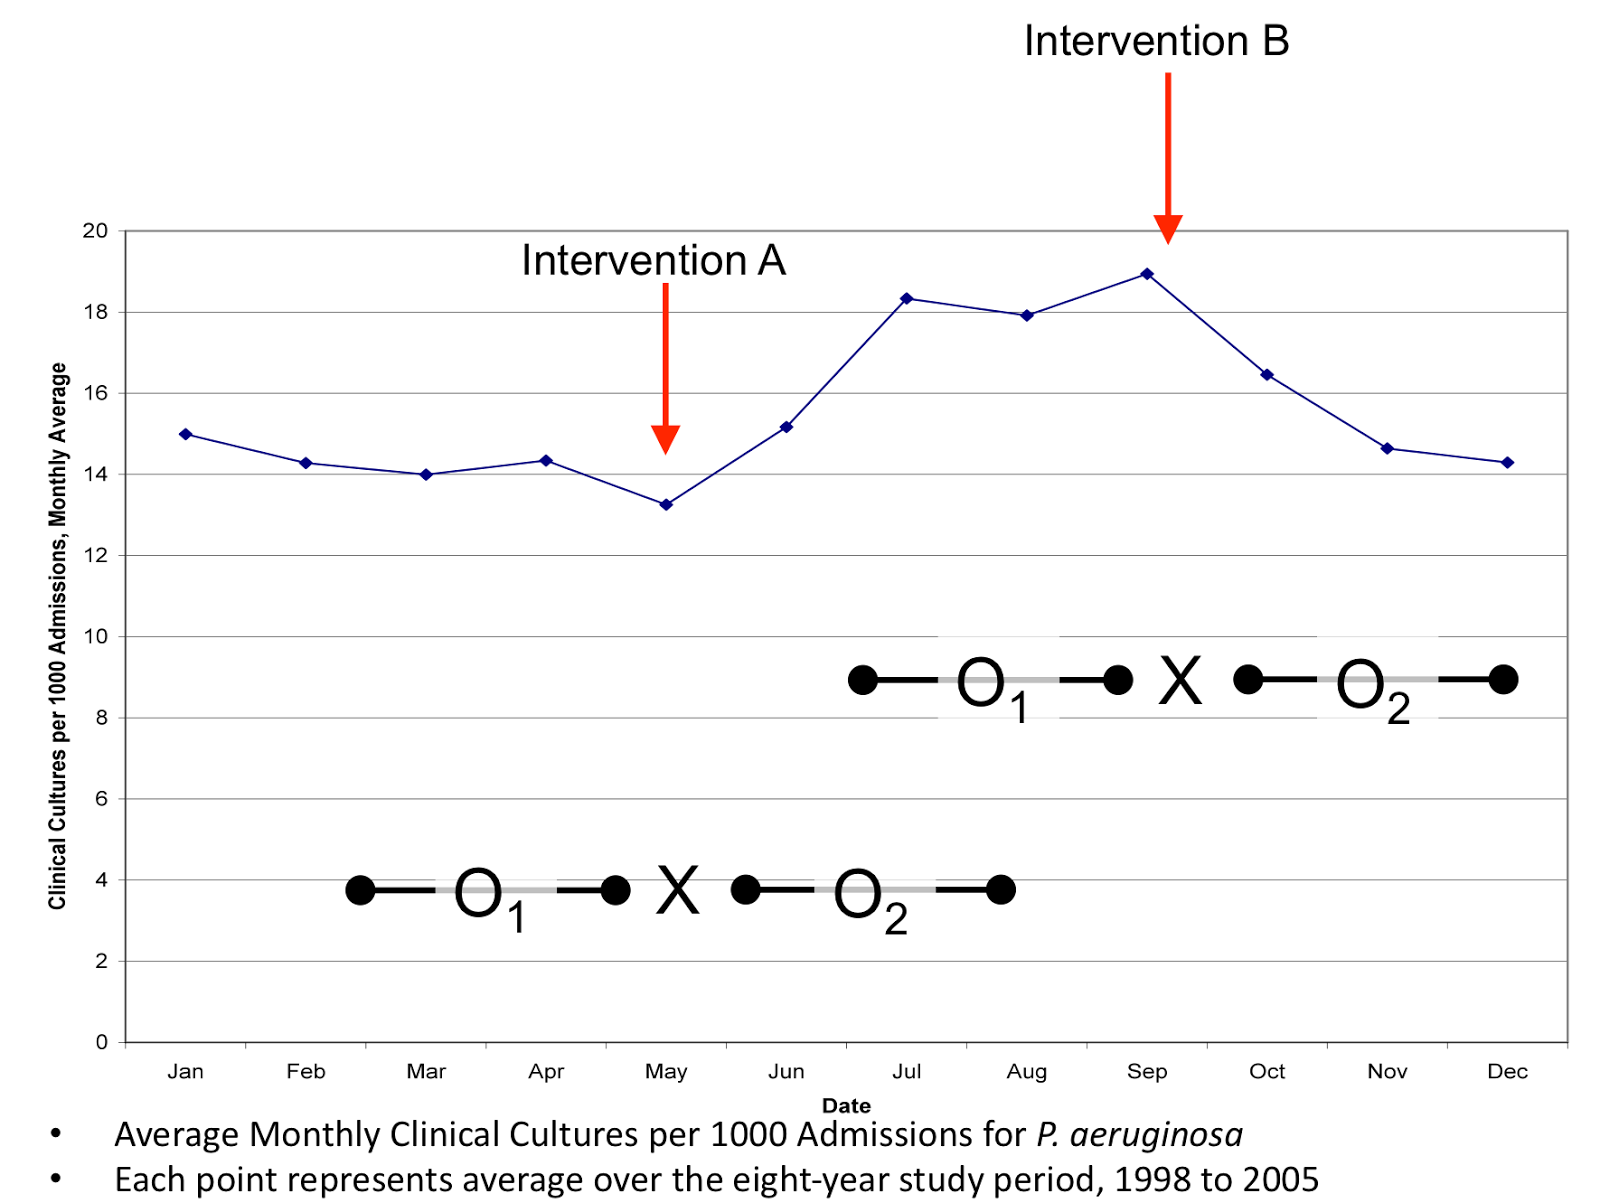
What if we waited to start interventions to control our peak in summertime pseudomonal infections until September (Intervention B)? I could then ride the epi curve to glory each fall as I reduced infections by 28%. I could then publish my findings and would be asked to write SHEA guidelines recommending what you should do. On the other hand, what if I tried to get ahead of things every spring and start intervening in May (Intervention A)? What if pseudomonal infections went up 5% over the next three months? In that case, I would be told my interventions didn’t work, I wouldn’t publish my findings and you’d certainly never let me write a SHEA guideline.
The moral of the story: the details of methods in health policy research really matter.
@koutterson
